Understanding and creating testplans
JMeter offers a very flexible and powerful tool kit to build a large variety of testplans. This document can only give a brief overview over what testplans are typically used for Corda performance testing. To get an overview of what is available in JMeter, and if you are looking into writing more elaborate testplans, please refer to the JMeter user manual.
Structure of a simple testplan

The testplan is a hierarchy of configuration elements. The only elements used in our simple test plans are Variables, Thread Groups, Samplers and Listeners. Rather than creating a new testplan from scratch, it might a good idea to take a copy of one of the provided example test plans and modify that.
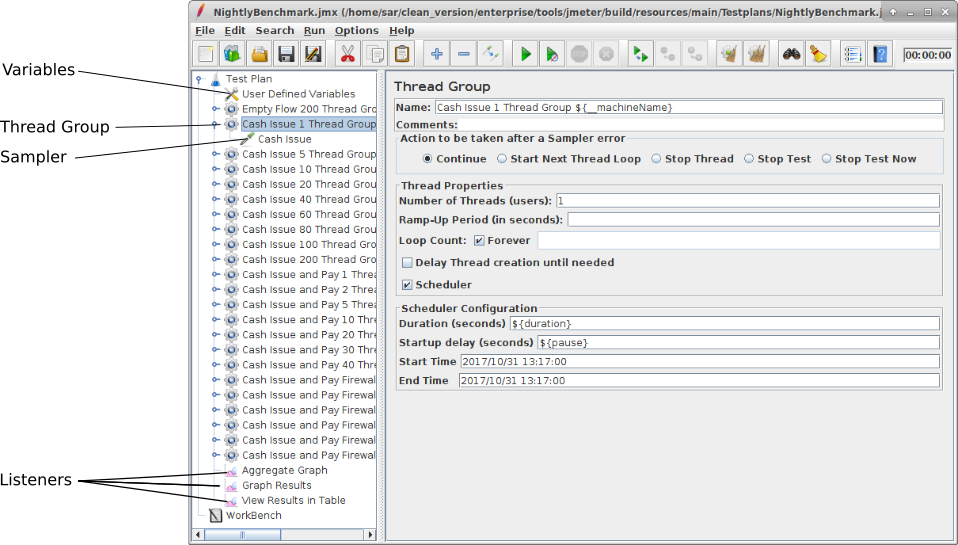
A variables element defines key/value pairs that can be used in all following following elements instead of string
literals. They can be referenced by using a $ sign and curly braces, e.g. ${varName}.

A thread group collects a set of actions that form one step in the test plan. All elements within a thread group will be run in order. As the name suggests, a thread group can spin up threads to run several instances of its content in parallel. Note that everything inside the group will be run in every thread (including any initialisation or tear down steps). However, the tear down steps will only be run when all thread groups have finished at the end of the test plan - not at the end of the thread group’s execution. It cannot be used to release resources that the next thread group is supposed to reuse.
The thread group also allows to repeat the action that has been configured. Repitition can either be count based, or scheduler based (e.g. for 5 minutes). Counter based repition will loop the given number of times for each thread, so 10 threads with 10 repetitions means 100 runs of group content. If a test plan contains a list of thread groups, they will be run sequentially. If the runtime of the thread group is controlled via a scheduler, a start-up delay is configurable that the process will wait between finishing the previous thread group and starting the next one, e.g. to let the system under test finish any lingering requests, flush queues and return to idle state.
Usually, there will be a sampler inside the thread group that creates the load for the Corda network via RPC
invocations. Note that the thread group will call setupTest only before the first iteration, and teardownTest
only after all tests in all thread groups have finished, but will call runTest for every loop iteration
configured in the thread group. However, all tasks are run for each thread in parallel. Listeners collect the output of samplers and handle it by either displaying it, storing it to file or aggregating it in some way. Note that starting and stopping does not clear data from the listeners, and some
statistics are calculated across runs and breaks, so clearing the relevant data before starting a run is vital when
running from the GUI.
The descriptions of all built-in listeners can be found in the documentation - here is a short list of listeners typically used for Corda runs. This output handler is useful for debugging the test system - every result will be displayed as a line in a table, including a status and stats about sent and received bytes. The table can become very long and unwieldy quickly when running with many threads and/or loops. This aggregator plots various stats about processing time and throughput over time. It can be handy to view trends, but as the time window is fixed and it loops back to the beginning and plots over existing graphs, the usefulness for long-running tests is limited. This aggregator collects processing time stats and throughput on a per thread group basis as a table, and keeps a running total for the run. This is similar to the Aggregate Report, but also offers tools to plot the results.
Included testplans
Two testplans are included with the performance test suite, to be found in the Sample Testplans directory in the zip
file. Note that both test plans are templates only and you cannot run them directly - first you need to set
the appropriate values for your Corda installation, such as host names, party/notary names, RPC credentials, and so on.
Example Flow Request.jmx: this is a very simple test plan that has one thread group that just runs self-issues cash. Everything is configured directly on the sampler’s page - you only need to enter the details of your installed Corda node. to go. The structure of this test plan is a good place to start creating your own test plans.NightlyBenchmarkSample.jmx: this is a copy of the test plan that is used for performance testing of Corda Enterprise at R3. This plan has a lot of different tests, each in its own thread group. All thread groups are run one after another. These different tests show the usage of all the different sampler clients described in JMeter Samplers. This test plan uses variables to avoid the repetition of values that might require changing. To get the test plan working, you must provide the appropriate values for your Corda network installation. A useful way to try out some parts of the test plan is to load it in an interactive JMeter session, and to disable most of the thread groups in order to only run a few tests. You can enable/disable thread groups from the right-click menu.
Creating testplans
The JMeter GUI can be used to create and try out new testplans. The easiest way of doing this to take a copy of an existing testplan and modify this as the structure of all testplans is fairly similar.
- Optionally, there can be user variables and set-up steps defined at the top of the test plan.
- Each plan needs one or more thread groups that contain the actual tests to run, i.e. samplers that exercise the system under test. Each thread group can just contain a sampler, or further logical elements like repetition/decision elements that run different samplers in various combinations.
- Thread groups can contain listeners that only process results from this thread group
- The testplan should have at least one global listener that captures results from all thread groups.
Detailed description of the parts of a test plan can be found in the JMeter documentation.
Was this page helpful?
Thanks for your feedback!
Chat with us
Chat with us on our #docs channel on slack. You can also join a lot of other slack channels there and have access to 1-on-1 communication with members of the R3 team and the online community.
Propose documentation improvements directly
Help us to improve the docs by contributing directly. It's simple - just fork this repository and raise a PR of your own - R3's Technical Writers will review it and apply the relevant suggestions.
We're sorry this page wasn't helpful. Let us know how we can make it better!
Chat with us
Chat with us on our #docs channel on slack. You can also join a lot of other slack channels there and have access to 1-on-1 communication with members of the R3 team and the online community.
Create an issue
Create a new GitHub issue in this repository - submit technical feedback, draw attention to a potential documentation bug, or share ideas for improvement and general feedback.
Propose documentation improvements directly
Help us to improve the docs by contributing directly. It's simple - just fork this repository and raise a PR of your own - R3's Technical Writers will review it and apply the relevant suggestions.