Node administration
Logging

Corda’s logging feature uses a Log4j 2 component and an SLF4J interface as its abstraction layer. You can find the latest Corda logging configuration file on GitHub.
- By default, node log files are stored to the
logssubdirectory of the working directory and are rotated from time to time. - Passing the
--log-to-consolecommand line flag logs printing to the console. - The default logging level is
INFOwhich can be adjusted by the--logging-levelcommand line argument. This configuration option will affect all modules.- Hibernate is Corda’s JPA provider. Hibernate-specific
WARNandERRORmessages are logged to the diagnostic log file, which is stored in thelogssubdirectory by default. Corda handles these messages internally, and they usually do not need operator attention. If they do, Corda logs them in the main node log file.
- Hibernate is Corda’s JPA provider. Hibernate-specific
- Aborted flows are marked with
ERRORorTERMINATE.
Custom logging
You can set custom logging settings using Log4j. The command to configure a custom logging file route is:
java -Dlog4j2.configurationFile=<myfile.xml> -jar corda.jar
Logger settings can be completely overridden with a Log4j2 configuration file assigned to the log4j.configurationFile system property.
Additionally, detailed logging around interactions with the database or HSM can be enabled by setting the logging-level to TRACE and
will be printed out in a separate file in the same location as the other log files, with a filename prefix of ‘details’. This type of
logging is better structured to allow for log processing by third party tools. MDC is also enabled for it. Currently, the following statement types are supported:
- fields: action, id, uploader
- actions: loading, loaded, store_start, store_created, store_updated, query_start, query_end, query_version_start, query_version_end
- fields: action, type, criteria, pagination, sorting
- actions: query_start, query_end
- fields: action, alias, scheme, found, algorithm, id, path, authState
- actions: generate_key_pair_start, generate_key_pair_end, key_lookup_start, key_lookup_end, key_get_start, key_get_end, signing_start, signing_end, get_signer, create_client, key_import, authenticate_start, authenticate_end, keystore_load_start, keystore_load_end
- fields: action, flowId, flow, state, flowState, subFlows, subFlowStack, exception, reason, error, suspends, session, errorState, numberOfSuspends
- actions: start, add_and_start, create_from_checkpoint, retry_safe_point, propagate_error, remove
- fields: action, flowId, size, platformVersion, id, to, from
- actions: send, receive
- fields: action, party
- actions: save_start, save_end
- fields: action, className, status
- actions: save_start, save_end
- fields: action, refs
- actions: loading, loaded
- fields: action, flowId, id, appName, message, flowVersion`, recipient
- actions: send_initial_message, send_existing_message
- fields: action, flowId
- actions: rollback
Example detailed log lines
[TRACE] 2019-07-18T15:39:29,741Z Flow(action=start;logic=net.corda.finance.internal.CashConfigDataFlow@2000e5f3;flowId=5eae65e6-a2c9-4eb8-a984-2b7f6877d2ee) {actor_id=user1, actor_owning_identity=O=PartyA, L=London, C=GB, actor_store_id=NODE_CONFIG, invocation_id=9ea253f7-72f9-40cc-a85e-727d0f3bbb42, invocation_timestamp=2019-07-18T15:39:29.718Z, origin=user1, session_id=881e4323-4353-43c3-b2e7-2146ffc32095, session_timestamp=2019-07-18T15:39:28.663Z}
[TRACE] 2019-07-18T15:39:29,828Z Flow(action=add_and_start;flowId=5eae65e6-a2c9-4eb8-a984-2b7f6877d2ee;flowState=Unstarted(flowStart=Explicit, frozenFlowLogic=4596BC25EB7986B7C0AB31F70A1DCC6628955983D5EB489B6C73AE6B6A849970);session={};subFlowStack=[Inlined(flowClass=class net.corda.finance.internal.CashConfigDataFlow, subFlowVersion=CorDappFlow(platformVersion=5, corDappName=corda-finance-workflows-5.0-SNAPSHOT, corDappHash=AD8EC11D5FF082D000245CEFB8F236EF231AAA5CC2E023DBED72B72A750B60D2), isEnabledTimedFlow=false)];errorState=Clean;numberOfSuspends=0) {actor_id=user1, actor_owning_identity=O=PartyA, L=London, C=GB, actor_store_id=NODE_CONFIG, invocation_id=9ea253f7-72f9-40cc-a85e-727d0f3bbb42, invocation_timestamp=2019-07-18T15:39:29.718Z, origin=user1, session_id=881e4323-4353-43c3-b2e7-2146ffc32095, session_timestamp=2019-07-18T15:39:28.663Z}
[TRACE] 2019-07-18T15:39:29,966Z Flow(action=remove;flowId=5eae65e6-a2c9-4eb8-a984-2b7f6877d2ee;reason=OrderlyFinish(flowReturnValue=CashConfiguration(issuableCurrencies=[], supportedCurrencies=[USD, GBP, CHF, EUR]))) {actor_id=user1, actor_owning_identity=O=PartyA, L=London, C=GB, actor_store_id=NODE_CONFIG, fiber-id=10000001, flow-id=5eae65e6-a2c9-4eb8-a984-2b7f6877d2ee, invocation_id=9ea253f7-72f9-40cc-a85e-727d0f3bbb42, invocation_timestamp=2019-07-18T15:39:29.718Z, origin=user1, session_id=881e4323-4353-43c3-b2e7-2146ffc32095, session_timestamp=2019-07-18T15:39:28.663Z, thread-id=219}
[TRACE] 2019-07-18T15:39:49,606Z Message(action=receive;size=2232;id=N-D-1338028259437713213--5426630988224494415-0-0;platformVersion=5;from=O=Notary, L=New York, C=US) {}
[TRACE] 2019-07-18T15:39:49,729Z Party(action=save;party=Anonymous(DL55FjJhasWWssQAFimPrwCMpzn5BHXX4CFS7yDuBPs3c1)) {actor_id=user1, actor_owning_identity=O=PartyA, L=London, C=GB, actor_store_id=NODE_CONFIG, fiber-id=10000002, flow-id=9fa62b8d-7229-478a-9a6c-0e0b8e9e3afb, invocation_id=7240b531-512a-4042-b5a9-45aa3ca5e62b, invocation_timestamp=2019-07-18T15:39:46.084Z, origin=user1, session_id=881e4323-4353-43c3-b2e7-2146ffc32095, session_timestamp=2019-07-18T15:39:28.663Z, thread-id=279, tx_id=C4EF4FD371B5E5839901A28DADF7BECFB745BFE274EA1EE5C8DBEEDC3BA5BA23}
The node is using log4j2 asynchronous logging by default (configured via log4j2 properties file in its resources)
to ensure that log message flushing is not slowing down the actual processing.
If you need to switch to synchronous logging (e.g. for debugging/testing purposes), you can override this behaviour
by adding -DLog4jContextSelector=org.apache.logging.log4j.core.selector.ClassLoaderContextSelector to the node’s
command line or to the jvmArgs section of the node configuration (see corda-configuration-file).
Additionally, you need to override the log4j2 configuration file by specifying -Dlog4j.configurationFile=<log4j2 config>.
The configuration file can be taken from the config/dev folder in Corda Community Edition repository.
When using synchronous logging with RollingRandomAccessFile appenders in the configuration file, make sure that they DO NOT
have immediateFlush=false setting.
shutdownHook="disable" is set if you are overriding the log4j2 configuration file
otherwise logs will not be flushed properly on shutdown and loss may occur. The option is set in the Configuration
tag of the log4j configuration file, for example <Configuration ... shutdownHook="disable">. This is because
Corda overrides the default log4j2 shutdown logic in order to make sure it gets shut down correctly.Example
Create a file sql.xml in the current working directory. Add the following text :
<?xml version="1.0" encoding="UTF-8"?>
    <Configuration status="WARN">
        <Appenders>
            <Console name="Console" target="SYSTEM_OUT">
                <PatternLayout pattern="%d{HH:mm:ss.SSS} [%t] %-5level %logger{36} - %msg%n"/>
            </Console>
        </Appenders>
        <Loggers>
            <Logger name="org.hibernate" level="debug" additivity="false">
                <AppenderRef ref="Console"/>
            </Logger>
            <Root level="error">
                <AppenderRef ref="Console"/>
            </Root>
        </Loggers>
    </Configuration>
Note the addition of a logger named org.hibernate that has set this particular logger level to debug.
Now start the node as usual but with the additional parameter log4j.configurationFile set to the filename as above:
java <Your existing startup options here> -Dlog4j.configurationFile=sql.xml -jar corda.jar
To determine the name of the logger, for Corda objects, use the fully qualified name (e.g., to look at node output
in more detail, use net.corda.node.internal.Node although be aware that as we have marked this class internal we
reserve the right to move and rename it as it’s not part of the public API as yet). For other libraries, refer to their
logging name construction. If you can’t find what you need to refer to, use the --logging-level option as above and
then determine the logging module name from the console output.
SSH access
Node can be configured to run SSH server. See Node shell for details.
Database access
When running a node backed with a H2 database, the node can be configured to expose the database over a socket (see node-database-access-h2).
Note that in a production set up, it is highly recommended to use an enterprise grade database, and access to the database should be via the usual database tools mechanisms, including access control and restrictions.
Monitoring your node
This section covers monitoring performance and health of a node in Corda Enterprise with Jolokia and Graphite. General best practices for monitoring (e.g. setting up TCP checks for the ports the node communicates on, database health checks etc.) are not covered here but should be followed.
Monitoring via Jolokia
Like most Java servers, the node can be configured to export various useful metrics and management operations via the industry-standard JMX infrastructure. JMX is a standard API for registering so-called MBeans … objects whose properties and methods are intended for server management. As Java serialization in the node has been restricted for security reasons, the metrics can only be exported via a Jolokia agent.
Jolokia allows you to access the raw data and operations without connecting to the JMX port
directly. Nodes can be configured to export the data over HTTP on the /jolokia HTTP endpoint, Jolokia defines the JSON and REST
formats for accessing MBeans, and provides client libraries to work with that protocol as well.
Here are a few ways to build dashboards and extract monitoring data for a node:
- Hawtio is a web based console that connects directly to JVM’s that have been instrumented with a jolokia agent. This tool provides a nice JMX dashboard very similar to the traditional JVisualVM / JConsole MBbeans original.
- JMX2Graphite is a tool that can be pointed to /monitoring/json and will scrape the statistics found there, then insert them into the Graphite monitoring tool on a regular basis. It runs in Docker and can be started with a single command.
- JMXTrans is another tool for Graphite, this time, it’s got its own agent (JVM plugin) which reads a custom config file and exports only the named data. It’s more configurable than JMX2Graphite and doesn’t require a separate process, as the JVM will write directly to Graphite.
- Cloud metrics services like New Relic also understand JMX, typically, by providing their own agent that uploads the data to their service on a regular schedule.
- Telegraf is a tool to collect, process, aggregate, and write metrics. It can bridge any data input to any output using their plugin system, for example, Telegraf can be configured to collect data from Jolokia and write to DataDog web api.
In order to ensure that a Jolokia agent is instrumented with the JVM run-time, you can choose one of these options:
- Specify the Node configuration parameter
jmxMonitoringHttpPortwhich will attempt to load the jolokia driver. - Start the node with
java -Dcapsule.jvm.args="-javaagent:path/to/jolokia-jvm-{VERSION}-agent.jar=port=7777,host=localhost" -jar corda.jarwherepath/to/jolokia-jvm-{VERSION}-agent.jaris the path to the driver, and{VERSION}is the version required by Corda, currently 1.6.1.
The following JMX statistics are exported:
- Corda specific metrics: see Node metrics for a list.
- Apache Artemis metrics: queue information for P2P and RPC services.
- JVM statistics: classloading, garbage collection, memory, runtime, threading, operating system.
Notes for production use
When using Jolokia monitoring in production, R3 recommends to use a Jolokia agent that reads the metrics from the node and pushes them to the metrics storage, rather than exposing a port on the production machine/process to the internet.
Also ensure to have restrictive Jolokia access policy in place for access to production nodes. The Jolokia access is controlled
via a file called jolokia-access.xml.
Several Jolokia policy based security configuration files (jolokia-access.xml) are available for dev, test, and prod
environments under /config/<env>.
To pass a security policy use java -Dcapsule.jvm.args=-javaagent:./drivers/jolokia-jvm-1.6.0-agent.jar,policyLocation=file:./config-path/jolokia-access.xml -jar corda.jar
Notes for development use
When running in dev mode, Hibernate statistics are also available via the Jolokia interface. These are disabled otherwise
due to expensive run-time costs. They can be turned on and off explicitly regardless of dev mode via the
exportHibernateJMXStatistics flag on the database configuration.
When starting Corda nodes using Cordformation runner (see Running a node), you should see a startup message similar to the following: Jolokia: Agent started with URL http://127.0.0.1:7005/jolokia/
When starting Corda nodes using the ‘driver DSL’, you should see a startup message in the logs similar to the following: Starting out-of-process Node USA Bank Corp, debug port is not enabled, Jolokia monitoring port is 7005 {}
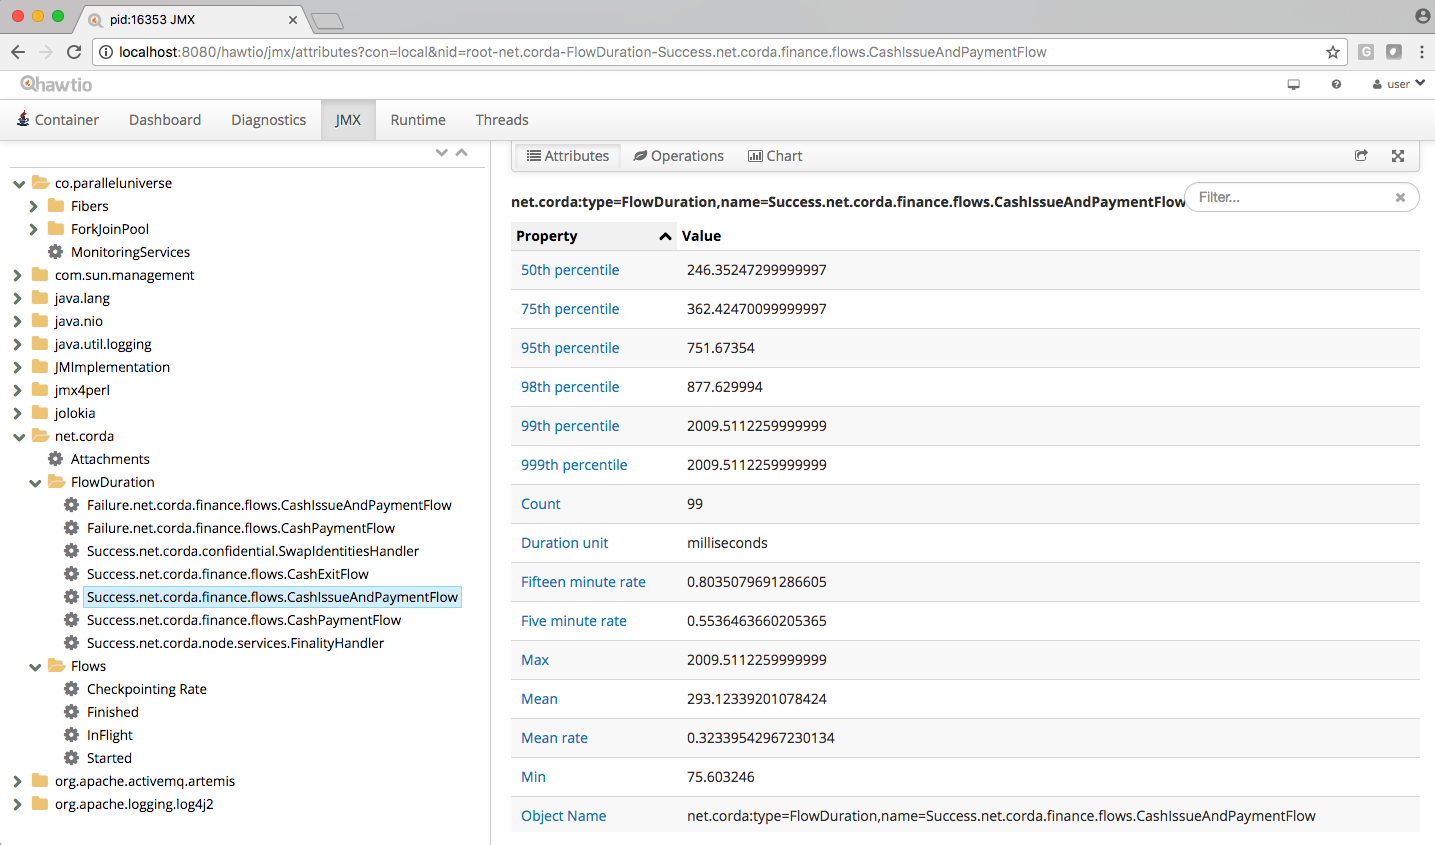
The following diagram illustrates Corda flow metrics visualized using hawtio:
Monitoring via Graphite
Corda nodes alternatively support publishing metrics collected via the Codahale metrics library directly to a graphite server. This needs to be configured in the node configuration file:
graphiteOptions = {
  prefix = "<node specific prefix>"
  server = <host name of the graphite server>
  port = <pickle receiver port on the graphite server>
}
The prefix should clearly indicate the node where the metrics are coming from, as this will be the top level discrimator in the graphite metric hierarchy. The graphite server must be running with python pickle transport enabled. Please refer to the documentation on https://graphiteapp.org on how to install and run a graphite server. Note that the default pickle receiver port on Graphite is 2004.
Memory usage and tuning
All garbage collected programs can run faster if you give them more memory, as they need to collect less frequently. As a default JVM will happily consume all the memory on your system if you let it, in development mode Corda is configured with a 512mb Java heap by default. When other overheads are added, this yields a total memory usage of about 800mb for a node (the overheads come from things like compiled code, metadata, off-heap buffers, thread stacks, etc).
If you want to make your node go faster and profiling suggests excessive GC overhead is the cause, or if your node is running out of memory, you can give it more by running the node like this:
java -Dcapsule.jvm.args="-Xmx1024m" -jar corda.jar
The example command above would give a 1 gigabyte Java heap.
devMode is explicitly [1] set to false the node memory size will be enlarged to 4G. This behaviour can be overridden by setting a custom memory size in the configuration file.[1]
If devMode is not explicitly configured but resolved to false based on OS environment, the default heap size remains 512mb.
Hiding sensitive data
A frequent requirement is that configuration files must not expose passwords to unauthorised readers. By leveraging environment variables, it is possible to hide passwords and other similar fields.
Take a simple node config that wishes to protect the node cryptographic stores:
myLegalName = "O=PasswordProtectedNode,OU=corda,L=London,C=GB"
keyStorePassword = ${KEY_PASS}
trustStorePassword = ${TRUST_PASS}
p2pAddress = "localhost:12345"
devMode = false
networkServices {
    doormanURL = "https://cz.example.com"
    networkMapURL = "https://cz.example.com"
}
By delegating to a password store, and using command substitution it is possible to ensure that sensitive passwords never appear in plain text.
The below examples are of loading Corda with the KEY_PASS and TRUST_PASS variables read from a program named corporatePasswordStore.
Bash
KEY_PASS=$(corporatePasswordStore --cordaKeyStorePassword) TRUST_PASS=$(corporatePasswordStore --cordaTrustStorePassword) java -jar corda.jar
Windows PowerShell
$env:KEY_PASS=$(corporatePasswordStore --cordaKeyStorePassword); $env:TRUST_PASS=$(corporatePasswordStore --cordaTrustStorePassword); java -jar corda.jar
For launching on Windows without PowerShell, it is not possible to perform command substitution, and so the variables must be specified manually, for example:
SET KEY_PASS=mypassword & SET TRUST_PASS=mypassword & java -jar corda.jar
Obfuscating sensitive data
Instead of hiding sensitive data using environment variables, another option is to use configuration obfuscation. Corda ships with a tools-config-obfuscator which allows the user to censor string properties in the configuration file. The config would look something like this:
keyStorePassword = "<{Kwby0G9c/+jxJM+c7Vaiow==:pdy+UaakdFSmmh8WWuBOoQ==}>"
trustStorePassword = "<{Kwby0G9c/+jxJM+c7Vaiow==:pdy+UaakdFSmmh8WWuBOoQ==}>"
p2pAddress = "localhost:12345"
devMode = false
The values for keyStorePassword and trustStorePassword in the above example are encrypted, using a key that is tied to the hosting machine’s primary hardware address. The implications of this is that:
- The configuration file is rendered unusable on other machines without manually decrypting obfuscated fields beforehand (since the hardware address would be different).
- Sensitive data is unreadable without additional processing.
- It becomes harder for adversaries to trawl for passwords and sensitive data on disk.
Backup recommendations
Various components of the Corda platform read their configuration from the file system, and persist data to a database or into files on disk. Given that hardware can fail, operators of IT infrastructure must have a sound backup strategy in place. Whilst blockchain platforms can sometimes recover some lost data from their peers, it is rarely the case that a node can recover its full state in this way because real-world blockchain applications invariably contain private information (e.g., customer account information). Moreover, this private information must remain in sync with the ledger state. As such, we strongly recommend implementing a comprehensive backup strategy.
The following elements of a backup strategy are recommended:
Database replication
When properly configured, database replication prevents data loss from occurring in case the database host fails. In general, the higher the number of replicas, and the further away they are deployed in terms of regions and availability zones, the more a setup is resilient to disasters. The trade-off is that, ideally, replication should happen synchronously, meaning that a high number of replicas and a considerable network latency will impact the performance of the Corda nodes connecting to the cluster. Synchronous replication is strongly advised to prevent data loss.
Database snapshots
Database replication is a powerful technique, but it is very sensitive to destructive SQL updates. Whether malicious or unintentional, a SQL statement might compromise data by getting propagated to all replicas. Without rolling snapshots, data loss due to such destructive updates will be irreversible. Using snapshots always implies some data loss in case of a disaster, and the trade-off is between highly frequent backups minimising such a loss, and less frequent backups consuming less resources. At present, Corda does not offer online updates with regards to transactions. Should states in the vault ever be lost, partial or total recovery might be achieved by asking third-party companies and/or notaries to provide all data relevant to the affected legal identity.
File backups
Corda components read and write information from and to the file-system. The advice is to backup the entire root directory of the component, plus any external directories and files optionally specified in the configuration. Corda assumes the filesystem is reliable. You must ensure that it is configured to provide this assurance, which means you must configure it to synchronously replicate to your backup/DR site. If the above holds, Corda components will benefit from the following:
- Guaranteed eventual processing of acknowledged client messages, provided that the backlog of persistent queues is not lost irremediably.
- A timely recovery from deletion or corruption of configuration files (e.g.,
node.conf,node-infofiles, etc.), database drivers, CorDapps binaries and configuration, and certificate directories, provided backups are available to restore from.
Checking node version and installed CorDapps
A nodeDiagnosticInfo RPC call can be made to obtain version information about the Corda platform running on the node. The returned NodeDiagnosticInfo object also includes information about the CorDapps installed on the node.
The RPC call is also available as the run nodeDiagnosticInfo command executable from the Corda shell that can be accessed via the local terminal, SSH, or as the standalone shell.
Example
Here is a sample output displayed by the run nodeDiagnosticInfo command executed from the Corda shell:
version: "4.9"
revision: "d7e4a0050049be357999f57f69d8bca41a2b8274"
platformVersion: 11
vendor: "Corda Open Source"
cordapps:
- type: "Contract CorDapp"
  name: "corda-finance-contracts-4.9"
  shortName: "Corda Finance Demo"
  minimumPlatformVersion: 1
  targetPlatformVersion: 4
  version: "1"
  vendor: "R3"
  licence: "Open Source (Apache 2)"
  jarHash: "570EEB9DF4B43680586F3BE663F9C5844518BC2E410EAF9904E8DEE930B7E45C"
- type: "Workflow CorDapp"
  name: "corda-finance-workflows-4.9"
  shortName: "Corda Finance Demo"
  minimumPlatformVersion: 1
  targetPlatformVersion: 4
  version: "1"
  vendor: "R3"
  licence: "Open Source (Apache 2)"
  jarHash: "6EA4E0B36010F1DD27B5677F3686B4713BA40C316804A4188DCA20F477FDB23F"
Managing trusted attachments
The node comes equipped with tools to manage attachments, including tooling to examine installed and uploaded attachments as well as those that were received over the network.
A Contract CorDapp (an attachment) received over the network, is only allowed to be evaluated if there are other Contract CorDapps installed in the node that have been signed by at least one of the received CorDapp’s keys.
See Signature Constraints and Signing CorDapps for use with Signature Constraints for more information
Shell commands
The following shell command can be used to extract information about attachments from the node:
attachments trustInfo
Outputs to the shell a list of all attachments along with the following information:
Whether an attachment is installed locally>
Trueif the attachment is installed in the CorDapps directory or uploaded via RPCFalsein all other scenarios, including attachments received from a peer node or uploaded via any means other than RPC
If an attachment is trusted
Which other attachment, if any, provided trust to an attachment
Below is an example out the command’s output:
Name                                          Attachment ID                                                        Installed             Trusted                Trust Root
--------------------------------------------------------------------------------------------------------------------------------------------------------------------------------------------------------
net.corda.dummy-cordapp-contracts-states      654CDFD0F195269B1C839DD9D539592B4DE7DD09BF29A3762EF600F94AE45E18     true                  true                   net.corda.dummy-cordapp-contracts-states
Corda Finance Demo                            71154836EBE54C0A60C6C5D9513EE015DB722EED57034B34428C72459CF133D7     true                  true                   Corda Finance Demo
Received from: O=PartyA, L=London, C=GB       CDDDD9A5C97DBF839445FFD79F604078D9D9766D178F698780EA4F9EA7A02D5F     false                 true                   net.corda.dummy-cordapp-contracts-states
Name column will be empty if the attachment has been stored without a name. Trust Root will also display an attachment
hash if there is no name to display.Name field containing Received from: O=PartyA, L=London, C=GB. The CorDapp is also trusted as another
CorDapp has been signed by a common key, the Trust Root field is filled in to highlight this.Was this page helpful?
Thanks for your feedback!
Chat with us
Chat with us on our #docs channel on slack. You can also join a lot of other slack channels there and have access to 1-on-1 communication with members of the R3 team and the online community.
Propose documentation improvements directly
Help us to improve the docs by contributing directly. It's simple - just fork this repository and raise a PR of your own - R3's Technical Writers will review it and apply the relevant suggestions.
We're sorry this page wasn't helpful. Let us know how we can make it better!
Chat with us
Chat with us on our #docs channel on slack. You can also join a lot of other slack channels there and have access to 1-on-1 communication with members of the R3 team and the online community.
Create an issue
Create a new GitHub issue in this repository - submit technical feedback, draw attention to a potential documentation bug, or share ideas for improvement and general feedback.
Propose documentation improvements directly
Help us to improve the docs by contributing directly. It's simple - just fork this repository and raise a PR of your own - R3's Technical Writers will review it and apply the relevant suggestions.