Practical considerations
This page is listing some practical considerations and tips that might be useful when performance testing Corda Enterprise.
Resetting a node

The Corda Enterprise test cluster at R3 uses an automated set-up to deploy Corda to the test machines, and in the process completely wipes the database - so resetting the state of the Corda test network is a matter of running a fresh installation and waiting a handful of minutes. This is the recommended set-up when running performance testing regularly, but might be too involved for occasional performance tests that can be run on manually-deployed clusters.
In these cases, the state of the installed node can be reset by doing the following:
- Stop the Corda node process.
- Delete the
artemisfolder in its working directory. - (Optionally) delete the
logsfolder. - Wipe the database for the node.
- Restart the node. It should rebuild its database and behave like a freshly installed and registered Corda node.
It is important to not delete any other files/directories from the node directory, as these are required for the node to restart
successfully.
This requires that the database user of the node has permission to create the respective tables/and indices. This is
not recommended in a production setting but might be useful in a performance testing context.
Also note that to allow liquibase to run and rebuild the schema, you need to run the run-migration-scripts sub-command.
Note that this will not reset the node registration, identity, keys or the network parameters - it only affects the states and transactions it knows about. If you have a performance test cluster, it is advisable to reset the whole cluster at the same time.
Wiping the database
How to wipe the node database depends on the database being used:
H2
In H2, wiping the database simply consists of deleting the files persistence.mv.db and persistence.trace.db from the node’s working
directory.
Microsoft SQL Server
To wipe the node’s database in SQL server, all the tables in the node’s schema need to be dropped - this is easiest to do in a database administration tool. Note that it is fairly likely that not all tables can be deleted in one go as they have foreign key indices depending on other tables, and SQL server does not allow dropping a table that other entities depend on. You can either drop the indices separately or just keep retrying deleting all tables until they are all gone (deleting a table will drop external indices as well, so theoretically dropping the tables in the right order should work).
Then, the hibernate_sequence and v_pkey_hash_ex_id_map view have to be dropped as well - make sure to substitute the correct
schema name for your node:
DROP SEQUENCE <SCHEMA NAME>.hibernate_sequence
DROP VIEW <SCHEMA NAME>.v_pkey_hash_ex_id_map
Postgres/Oracle
In PostgreSQL and Oracle, it is possible to just drop the schema for the node - this will wipe all tables/sequences/indices/views.
Interpreting and trouble-shooting JMeter output
To collect the output of a JMeter performance run, we need to add listeners to the test plan. Some useful listeners include:
- View Results in Table: This listener just lists all the runs that have been completed, one run per row, stating the thread name, sampler label, the sample time in milliseconds, the result status and the latency in milliseconds, among other (usually less useful) fields.
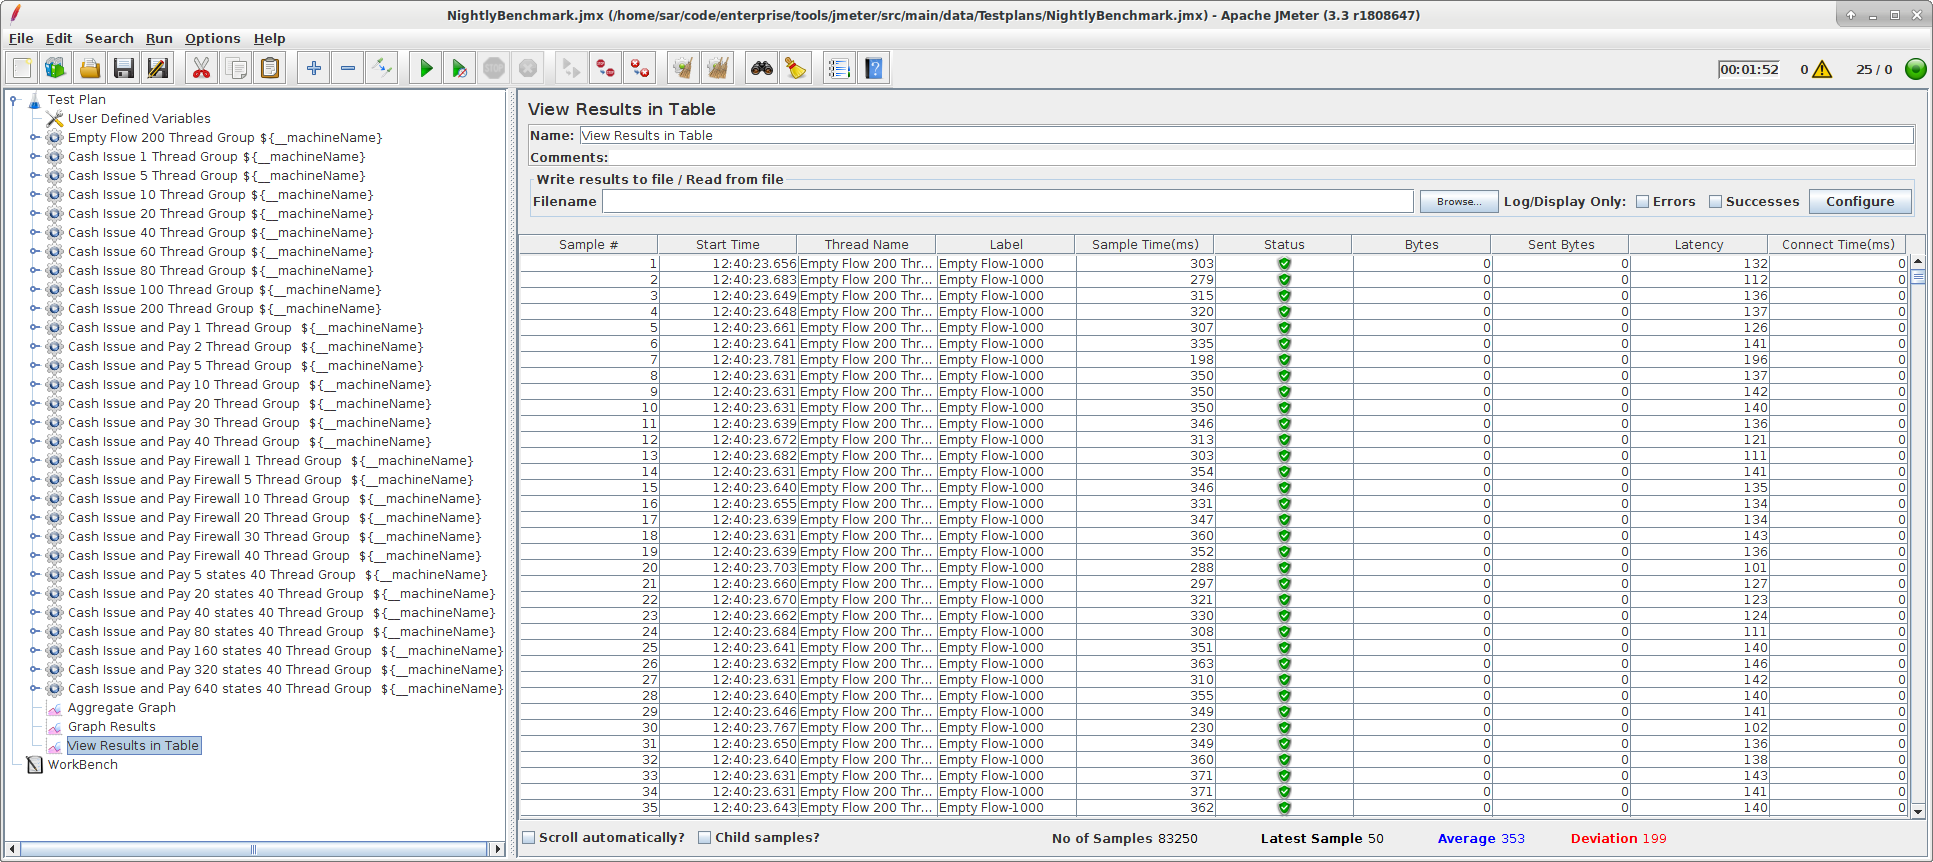
This view is particularly useful when trying out any changes (new flow, new sampler, new installation) to see if it is working at all. The potential outcomes are:
- The list stays empty. Most likely something is wrong in the set-up of the node and the jmeter server process, and requests never actually make it to start a flow. Check the logs of the JMeter client and the JMeter server process.
- Runs return as errors (status is a read cross mark). The test set-up itself works, submit runs and receives results, but something is going wrong with the flows. The most likely reason is that something is wrong with either the Corda installation or the CorDapp under test. The first place to check is the logfile of the node that is driving the tests, then logfiles of any nodes it is supposed to talk to.
- Runs return with success results (a green check mark like in the example image above). It seems to be working, ready to run performance tests.
This kind of check needs potentially to be run for each sampler - right-clicking a thread group in the test plan allows to disable/enable running of this group. To check a specific sampler, disable all thread groups except one that uses this sampler, then clear all data and rerun. It might also be a good idea to temporarily reduce the number of runs and threads on the thread group to single out a failing run and get a clear trace of error messages in case something goes wrong.
This view is also useful to look at the sample time and latency of single flows. The latency is the time JMeter takes to prepare the running of a flow (getting the RPC client, creating the flow instance, setting any data and so on). The sample time is measured from submitting the flow to the node via RPC until the result is returned to the client.
- Aggregate Graph: This listener aggregates all the runs for each thread group and the whole test plan and presents some basic statistics. It also allows plotting these statistics in basic charts and to save the results as a csv file. This is what we use for looking at the performance results on a day to day basis.
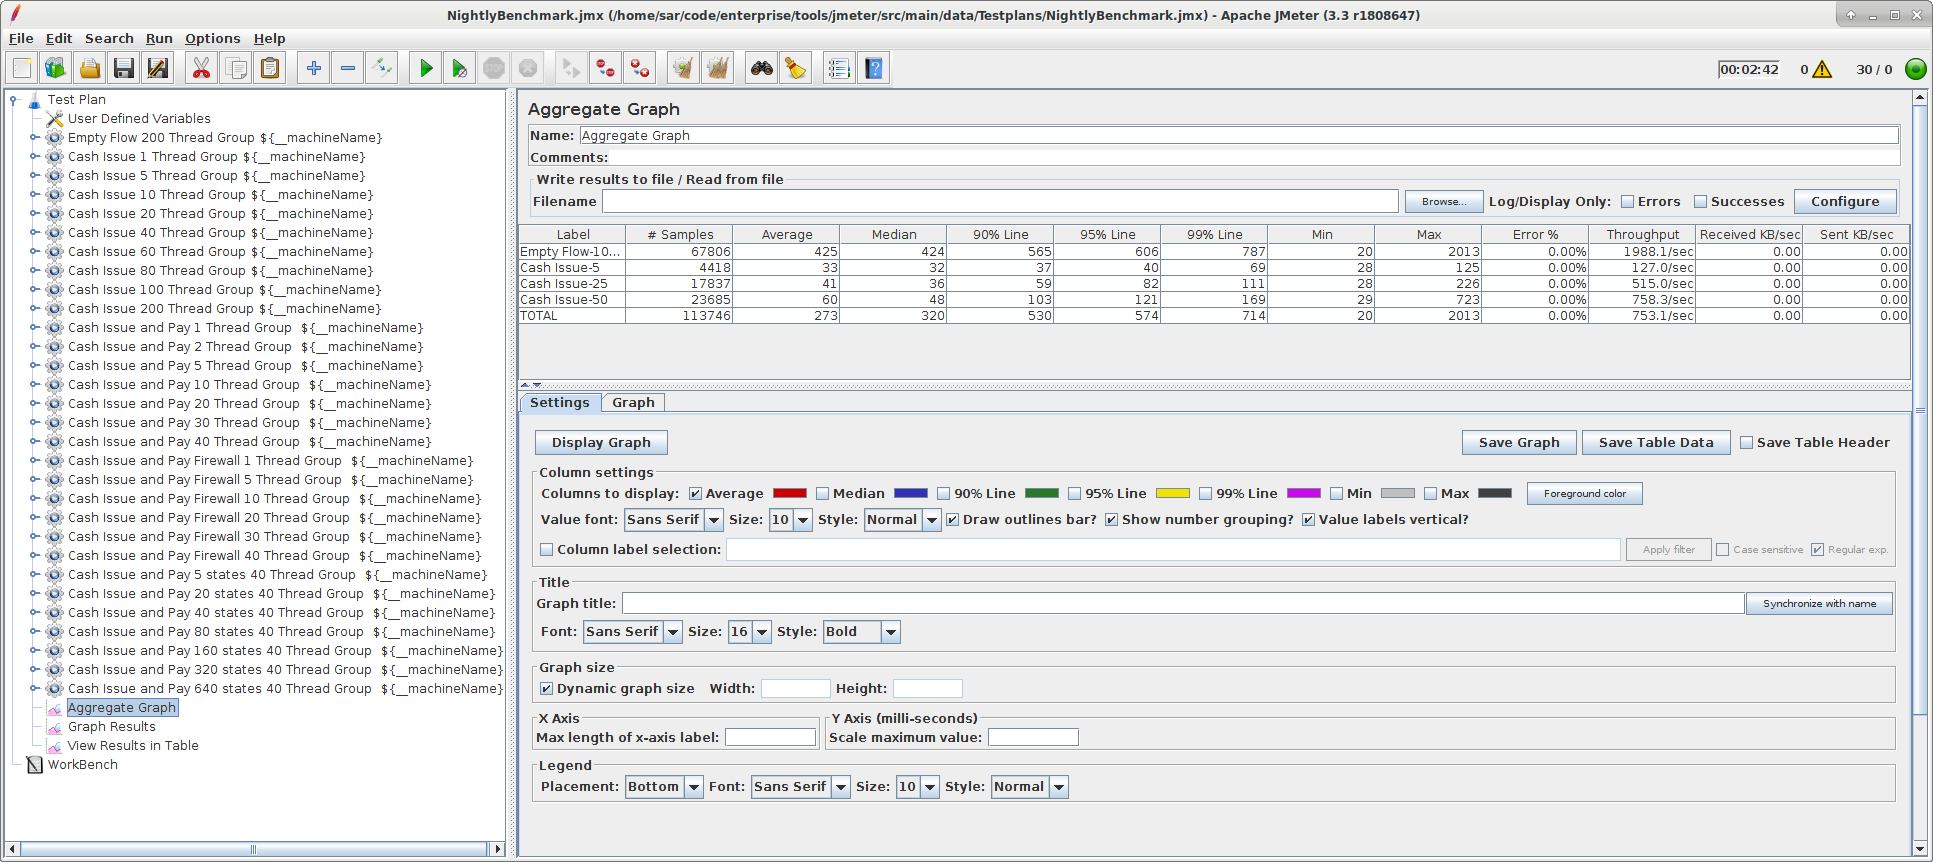
- The first two columns list the sampler’s label and the number of samples run via this sampler.
- The next seven columns show statistics about the run time for the samples in milliseconds.
- The next column shows the error rate (i.e. how many percent of runs errored). For a successful performance test this should be zero.
- The throughput column shows the actual throughput of the system, in runs finished per time unit. Note that the time unit of this column is dynamic, this can typically be in 1 over minutes or seconds, depending on the magnitude of the observed throughput. Another thing to keep in mind is that this is counting finished runs, so it will start with a lower number and then increase towards the steady state number as the system keeps running, and the number of finished runs within a given time matches the number of started runs. This is one of the reasons why performance runs need to take a while - this number takes a while to stabilize, so don’t get throughput reading from runs that ran for less time than at least a couple of minutes.
- The last two columns are meaningless in the context of a Corda sampler and should be ignored.
The graph section can be handy to visualize the distribution of the statistics.
Was this page helpful?
Thanks for your feedback!
Chat with us
Chat with us on our #docs channel on slack. You can also join a lot of other slack channels there and have access to 1-on-1 communication with members of the R3 team and the online community.
Propose documentation improvements directly
Help us to improve the docs by contributing directly. It's simple - just fork this repository and raise a PR of your own - R3's Technical Writers will review it and apply the relevant suggestions.
We're sorry this page wasn't helpful. Let us know how we can make it better!
Chat with us
Chat with us on our #docs channel on slack. You can also join a lot of other slack channels there and have access to 1-on-1 communication with members of the R3 team and the online community.
Create an issue
Create a new GitHub issue in this repository - submit technical feedback, draw attention to a potential documentation bug, or share ideas for improvement and general feedback.
Propose documentation improvements directly
Help us to improve the docs by contributing directly. It's simple - just fork this repository and raise a PR of your own - R3's Technical Writers will review it and apply the relevant suggestions.