Performance benchmarking results
This page captures the results of historical benchmarking measurements performed by R3. Unless otherwise stated, the necessary tooling is available as part of the performance test suite and it can be used to reproduce the same work.
Comparing Corda Enterprise Edition 4.0 vs Corda Enterprise 3.x and Corda Community Edition

This section describes how Corda Enterprise Edition 4.0 nodes perform relative to Corda Enterprise 3.x in certain circumstances. It also shows how the throughput changes with the number of output states per transaction and how that allows the node to achieve a greater number of Corda states to be transacted per second.
In addition it describes how Corda Enterprise performs, and can take advantage of, different host configurations whether Virtual Machines or dedicated hardware, and how you might adjust the configuration and hosting of the node to influence the performance based on the benchmarking experience of R3 on Corda Enterprise 3.
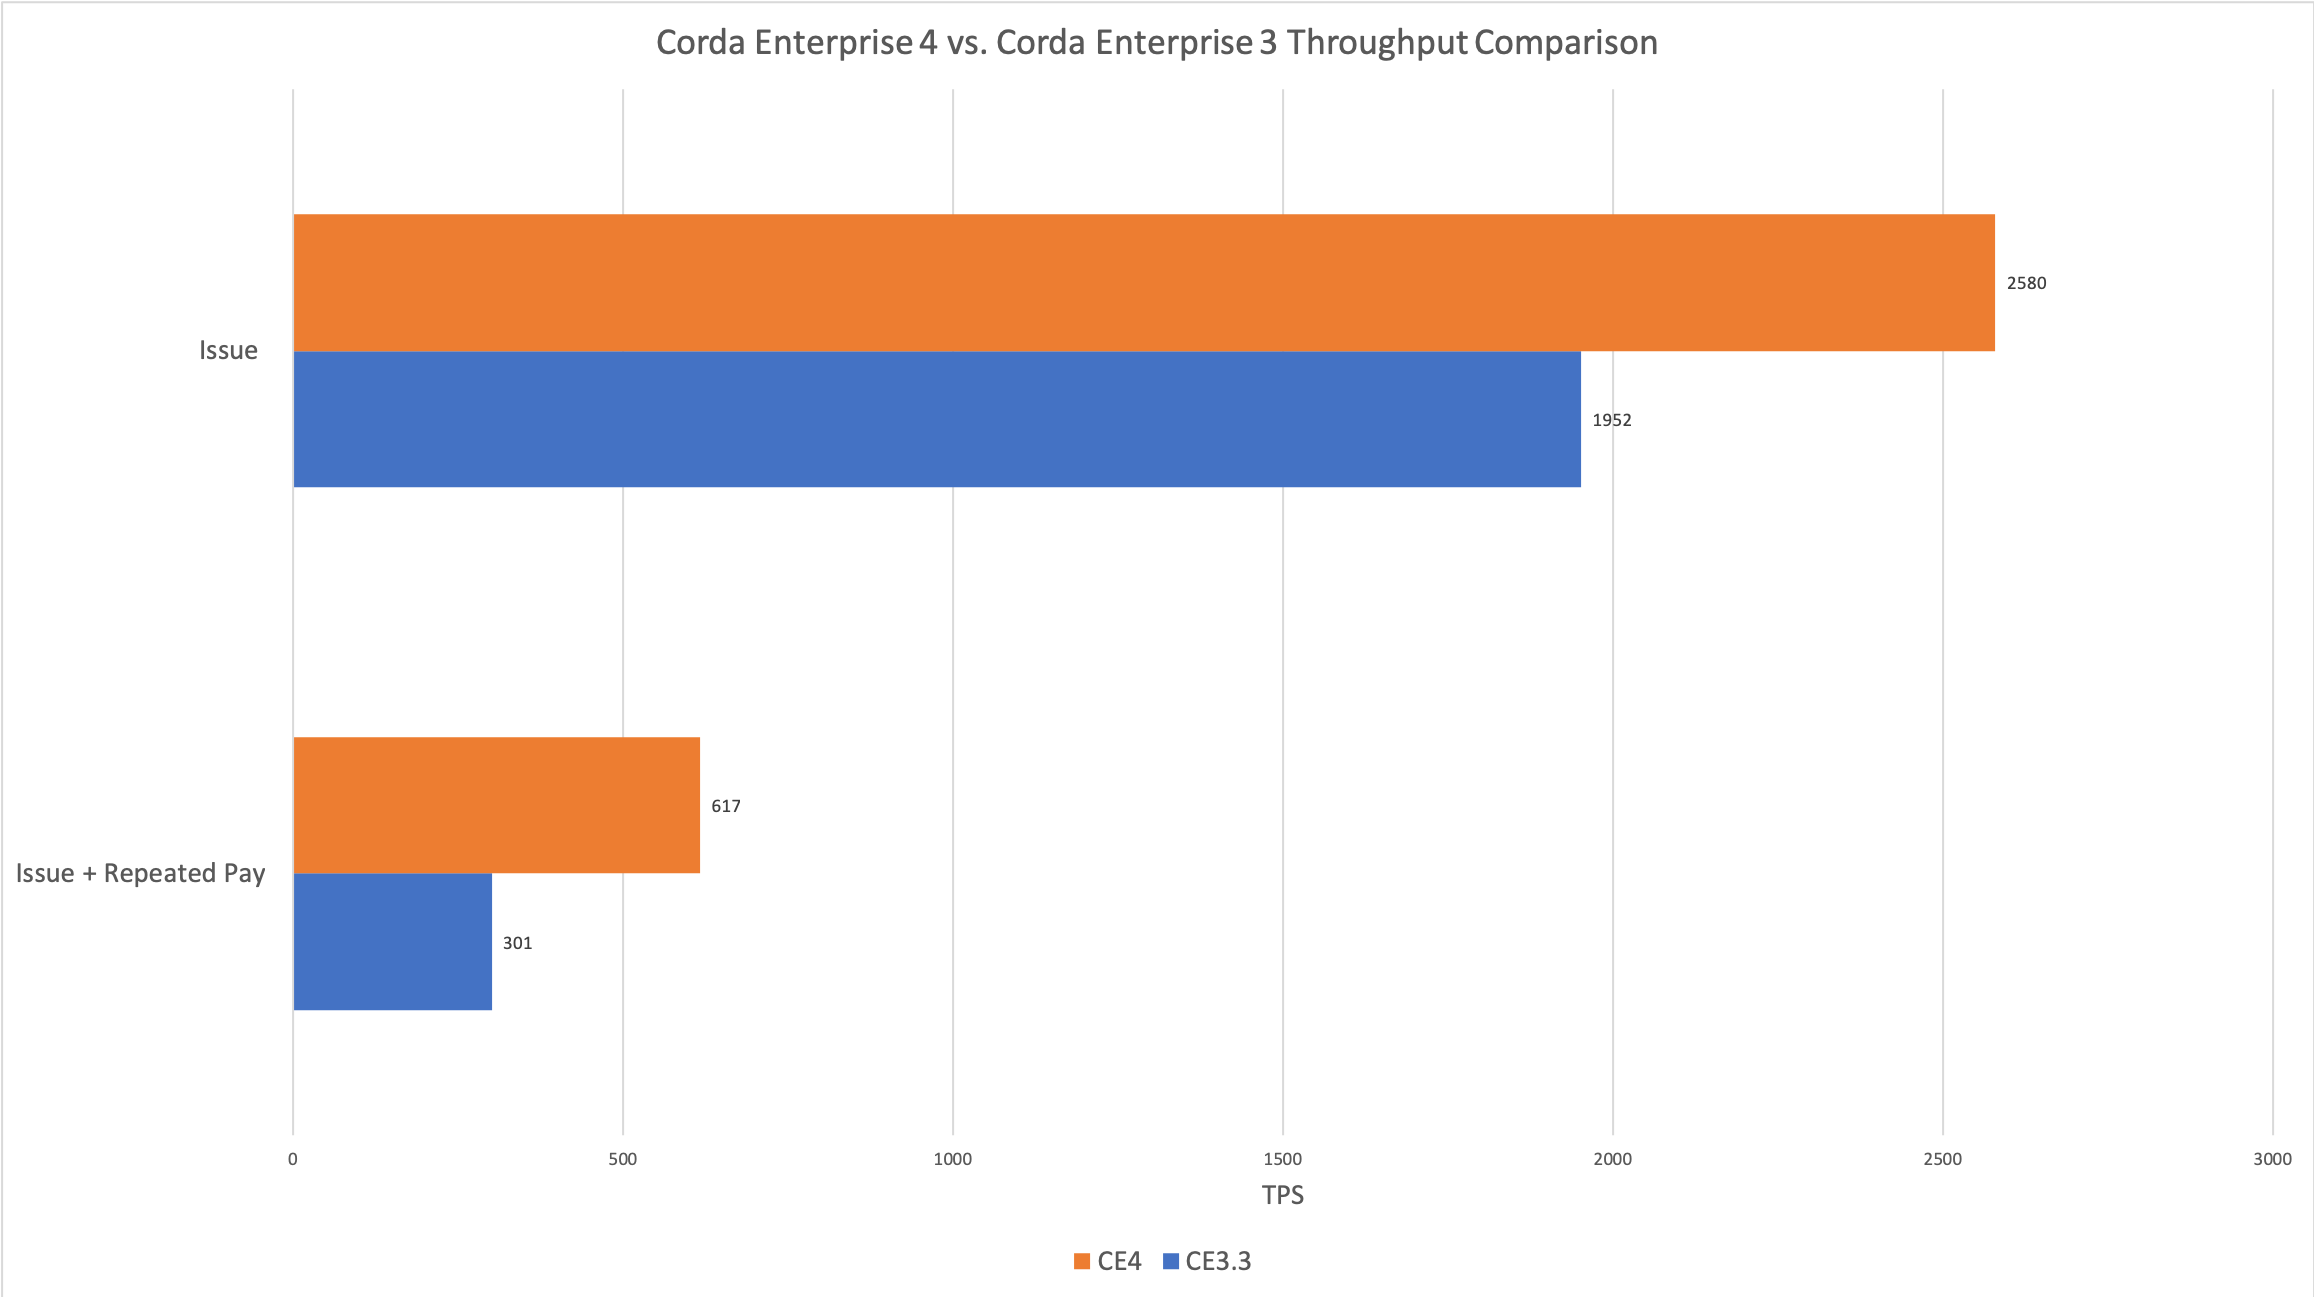
The x-axis represents the number of flows completing per second which equates to Transactions Per Second (TPS). As you can see, Corda Enterprise Edition 4 offers a substantial increase in Transactions Per Second (TPS) over the prior release on the same hardware.
Figure 2 shows how the relative performance of making multiple payments from one node to another via the notary in a single transaction varies with the number of those payments combined together. This can be useful to understand how scalability varies with transaction size and how batching might be a technique for even greater throughput.
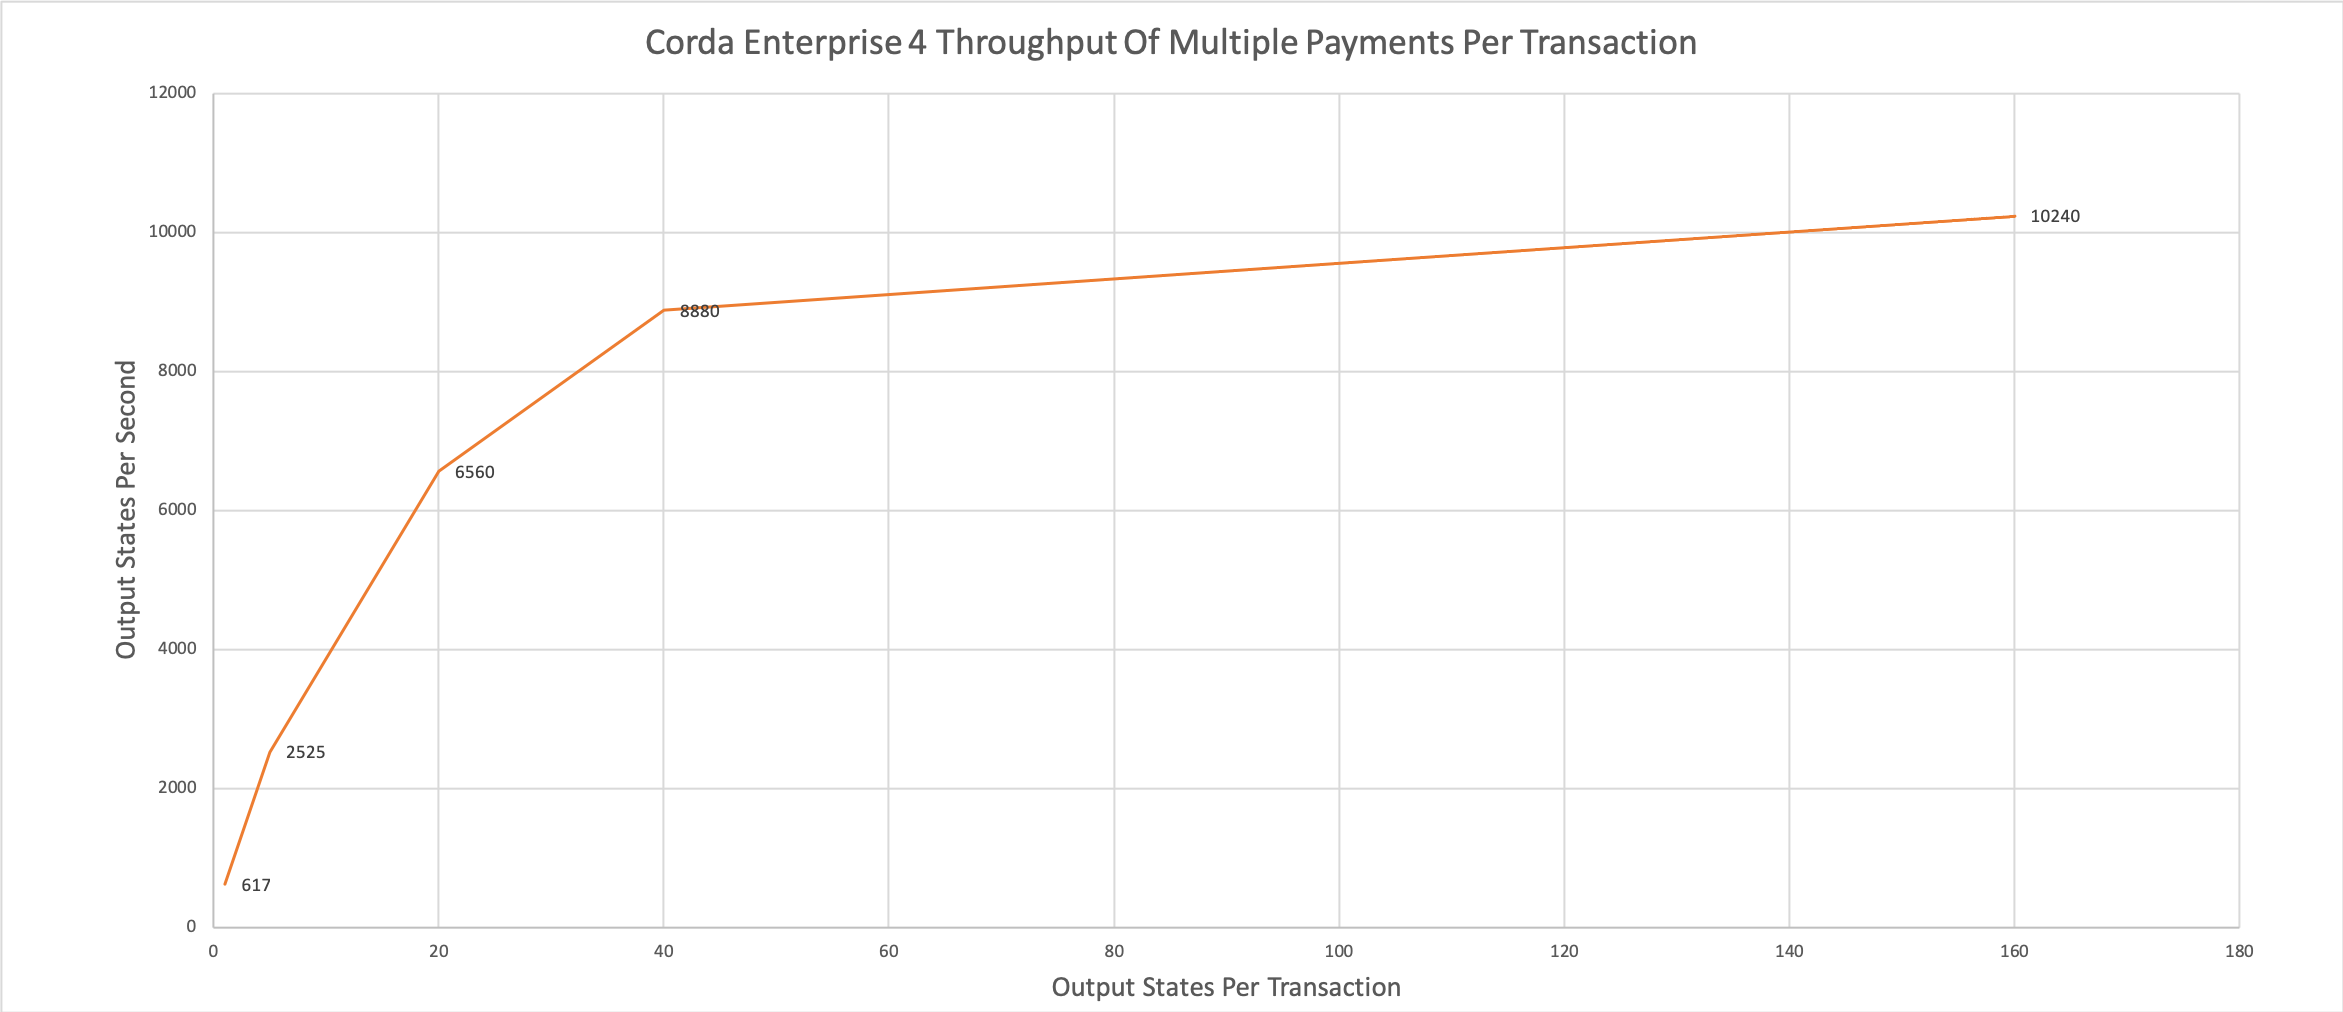
The y-axis represents the number of output contract states being recorded in the vault per second. The x-axis represents the number of output contract states in each transaction.
For comparing Corda Enterprise performance with differing node memory and CPU configurations, the numbers in the high level comparison chart of Figure 3 were achieved using Corda Enterprise 3.0 on Microsoft Azure virtual machines (VM), running against a Microsoft SQL Server database. Each node had their own instance of the database running on a separate VM from the node, with minimal latency between the node VM and the database server VM.
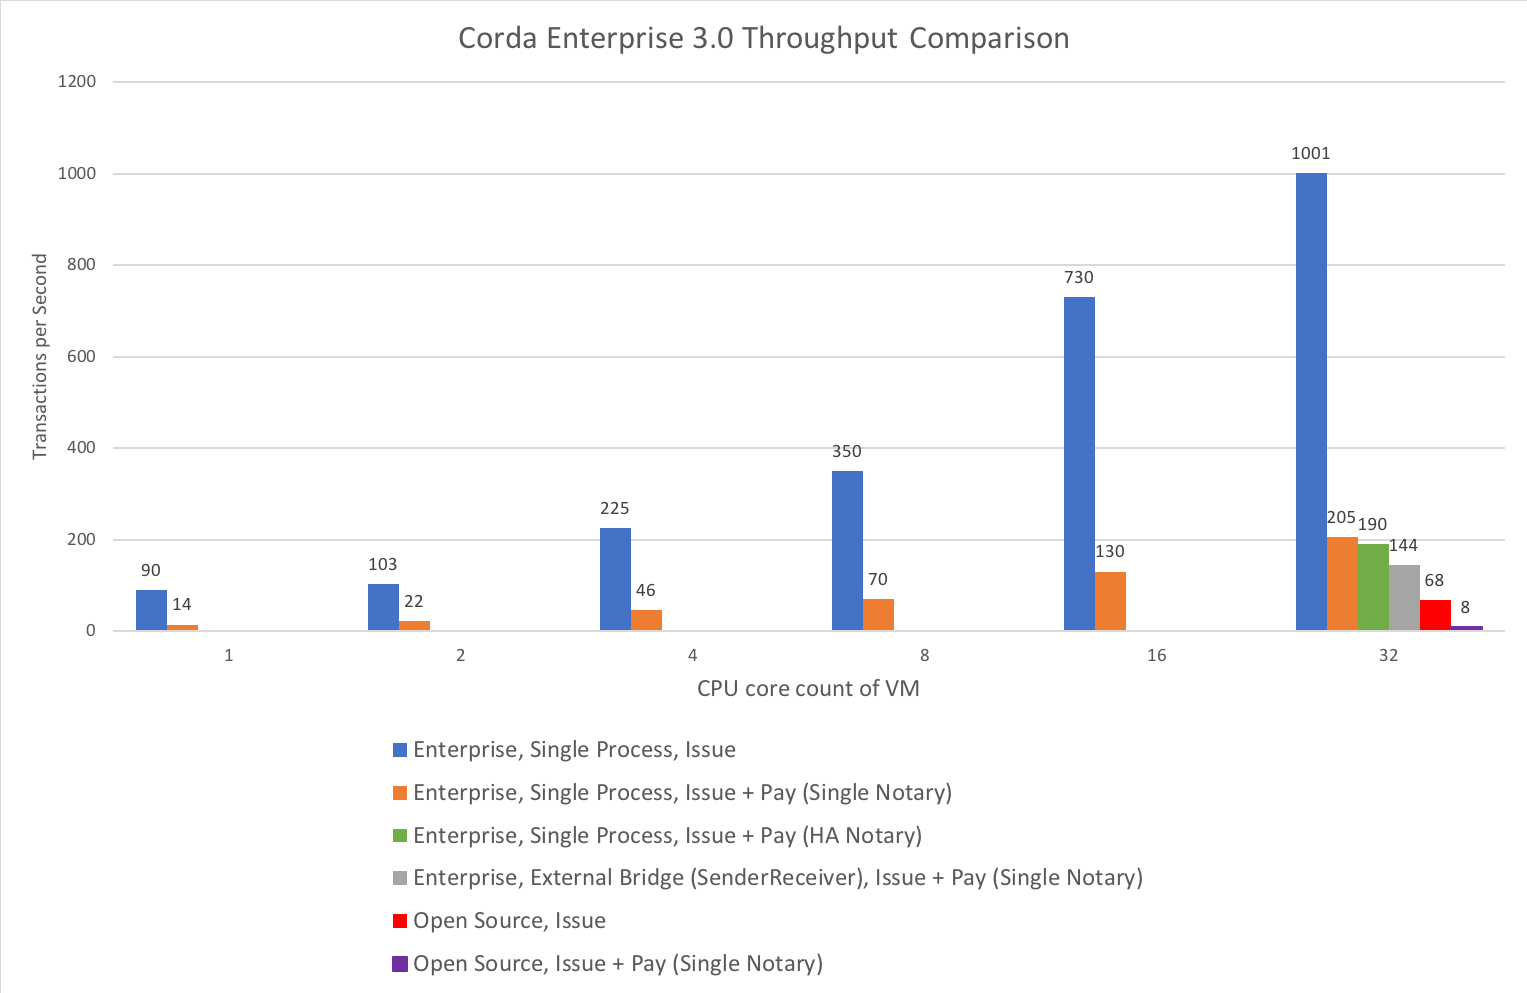
The y-axis represents the number of flows completing per second, which we call Transactions Per Second (TPS) for simplicity although the actual number of Corda transactions per flow completing varies depending on the type of flow. The x-axis represents the performance with varying numbers of CPU cores configured for the VMs. Each bar indicates the performance of a particular type of flow and with a particular high-level node (or nodes) configuration as depicted by the bar colour.
See the sections below for a discussion of the configurations used in these tests.
Observations
- Corda Enterprise Edition 4 has greater throughput than Corda Enterprise 3 (up to 2x in our tests).
- Even a single core deployment of Corda Enterprise offers greater throughput than Open Source Corda.
- There can be throughput benefits to combining multiple states or business transactions into a single Corda transaction.
- Corda Enterprise can utilise servers in excess of 16 cores.
- Corda Enterprise can scale approximately 10x by adding more cores for the flows used in the benchmarks.
- A lightly used node can operate in 1GB of heap space and a small number of cores for the flows used.
- A 32GB heap is sufficient for large core counts and numbers of parallel flows, for the flows used, but even larger can be beneficial.
- Corda Enterprise throughput is dependent on the throughput of the underlying RDBMS.
- The latency between the node and the database should be kept to a reasonable minimum.
- The use of OpenSSL may be required to achieve some of the higher throughput numbers between two nodes.
Sizing
With all of the preceding caveats and those that follow in the more detailed sections regarding how much all this depends on the CorDapps and workload, here are some simplistic node sizes. Refer to detail elsewhere in this section on what processing can be achieved with these sizings.
| Size | JVM Heap | # Cores | Minimum Host RAM |
|---|---|---|---|
| Small | 1GB | 1 | 2GB to 3GB |
| Medium | 4GB | 8 | 8GB |
| Large | 32GB | 32 | 64GB |
| X-Large | > 32GB | > 32 | > 64GB |
It’s likely you’ll have (much) more RAM in larger VMs and physical servers, so feel free to give the node more heap. Disk requirements should be sufficient to store the binaries, log files (which could be large) and the Artemis MQ journal files, the latter dependent on queued messages. Several GB should be sufficient.
The flows used in the measurements
The results currently cover two main types of flow:
- Issue. This is a flow that issues a
FungibleAssetbased on theCashstate and contract in thefinancemodule. The state is issued on a single node, in a single Corda transaction, is not notarised and appears in the vault of that node only thus there is no peer-to-peer communication taking place. - Issue + Pay. This is a more complex flow interaction made up of two high level steps of issuing a state to the local node (node A) in one Corda transaction (identical to Issue described above) and then transfering ownership of that state to a second node (node B). Additionally the contract requires that this second transfer transaction be timestamped and notarised, so the transaction is sent to the Notary by node A before all signatures are returned to node A who forwards to node B. It is important to note that this flow is much more complex in terms of the peer-to-peer communications than that description makes clear. Node B will never have seen the issuance transaction that contains the input state for the payment transaction and so node B enters transaction dependency resolution to request the first transaction from node A, resulting in additional sub-flows and peer-to-peer communication.
- Issue + Repeated Pay This flow issues some states on Node A and then repeatedly transfers a fraction of those states to Node B via the Notary. It is possible to configure the number of output states generated and transfered to Node B in each transaction in order to demonstate the effects of doing so on throughtput.
In summary, the Issue flow is pretty much the lightest weight flow imaginable that generates a Corda transaction. Issue + Pay and Issue + Repeated Pay are somewhat middling in complexity and the load it generates for a node. In future releases we will expand the range of scenarios to cover some in between, and some much more complex involving more steps, greater variety of transaction sizes and/or more nodes with the hope that one of these could act as a proxy for your own flows if they don’t yet exist and cannot therefore be benchmarked. No two flows are the same and therefore any debate around sizing naturally leads to conversations around what type of flows, what size transactions involving what kinds of states and contracts. We thus can only give you a flavour of what might actually be required and/or possible.
We launch these flows using the RPC client. A limited number of flows are launched in parallel (up to 800 outstanding flows in the case of Issue) in order for the node to have enough load to reflect the performance expected and exploit the multi-threaded capabilities without overwhelming it with long queues of pending work (that will form a separate scenario as we develop the performance test suite further). Also see Limiting outstanding flows.
We measure the time taken from the time just before we request the execution of a flow from the RPC client to the time after we see the Future returned
from startFlow RPC call complete on the client. At this point the transaction is recorded in all nodes that participate in the transactions and all sub-flows are
complete.
The node configurations used in the measurements
We have established results for a number of different software configurations:
- Single Notary. In Corda Enterprise 3 this uses the simple single node notary in non-validating mode. It persists to a Microsoft SQL Server database running on a distinct VM or server, both for notary specific data and other regular node data persistence. In Figure 3, these notaries always ran on an 8 core VM and on dedicated hardware the same as the nodes in Figure 1, although it was overkill and something lesser would be suitable as the load is not as significant as it is for other nodes. For Corda Enterprise Edition 4, the notary is actually using a slightly enhanced implementation that is less of a bottleneck and will be released in a later point release of Corda Enterprise.
- Highly Available Notary. In Figure 3, this uses a notary cluster made up of 3 nodes in non-validating mode. Normal node persistence uses a Microsoft SQL Server database but the notary state is maintained in a version of MySQL utilising a clustering technology as described in running-a-notary-cluster/ha-notary-service-setup. For full disclosure (and convenience for us) all 3 nodes are running in one data centre, which would not be a typical deployment. Whilst the latency between cluster members influences the performance of the notary itself, it is not operating at its limit even in that scenario here. These notaries always ran on an 8 core VM.
- Open Source. In Figure 3, this uses the latest available Corda Community Edition at the time of the test, persisting to an in-process H2 database.
- External Bridge (SenderReceiver). This is the Corda Firewall. In Figure 3, this hosts the inbound and outbound peer-to-peer traffic endpoint in a separate JVM process, rather than embedded in the main node JVM process.
In all cases the Artemis MQ broker is running within the node JVM. For the Corda Enterprise Edition 4 tests in Figures 1 & 2 we used OpenSSL as discussed later with respect to network bandwidth.
For the tests run against Corda Enteprise 4 (and the equivalent comparisons of 3.3) in Figures 1 & 2 we used dedicated hardware for the nodes. All nodes were 24 core (48 hyper-thread) based on 2x Intel Xeon E5-2687Wv4 with 256GB RAM and local SSDs.
We used the following Azure VM types for the nodes in the original Corda Enterprise 3.0 testing shown in Figure 3:
| Azure VM type | # Cores |
|---|---|
| DS1_v2 | 1 |
| D2s_v3 | 2 |
| D4s_v3 | 4 |
| D8s_v3 | 8 |
| D16s_v3 | 16 |
| D32s_v3 | 32 |
Database server configuration
In the Corda Enterprise Edition 4.0 testing for Figures 1 & 2 we have used dedicated database servers with single Intel Xeon E5-2687Wv4 giving 12 cores (24 hyper-threads), 256GB RAM and local SSDs. They ran SQL Server 2017 Standard Edition.
The servers used in the original Azure hosted tests shown in Figure 3 were 4 cores, 28GB RAM (Azure DS12 v2 VM). Each had only one data disk (limited to 5000 IOPS). They ran SQL Server 2017 Standard Edition.
It’s important to note that like many applications, the node is very sensitive to latency between the node and database servers. We kept the latency here to a minimum, without resorting to any extreme measures, by keeping them in the same location and on the same subnet. We have tested with databases separated from the node with increased latency (high single digit, low double digit millisecond - effectively cross region) and it significantly impacts performance, with flows taking much longer to complete and overall throughput reduced accordingly.
Database storage
In our performance tests, on Microsoft SQL Server 2017, we see database table space usage of around 10KB per state with an additional 10KB per transaction. So a transaction with 3 output states would use 10KB + (3 x 10KB) = 40KB of storage. This will obviously vary dependent on the complexity of the states and the extent to which they implement vault schema mappings, and is something that is likely to be changed in future releases as we finesse transaction storage in the light of performance and privacy requirements.
Scaling with CPU core count
Corda Enterprise provides the capability to make use of multiple cores by running flows simultaneously. When a flow is running (and not waiting for peer-to-peer messages), it splits its time between computation (running contract verification, signing transactions, and so on) and database write and read operations. When giving a node more and more CPU cores in order to scale up, at some point the balance of processing will shift to the database and the node will no longer be able to take advantage of additional CPU cores, reflected in an inability to drive CPU utilisation towards 100%.
Whilst the Figure 3 testing shows scaling with different core counts, the Corda Enterprise Edition 4.0 throughput tests in Figure 1 are achieved on dedicated servers with 48 hyper-threads (24 cores). At the peak, these are fully utilising 36 hyper-threads/cores (or 75%) in the node. As you can see in Figure 3 the node scales relatively well and clearly demonstrates the ability of the node to utilise larger numbers of cores.
Also see the section on heap size regarding Netty memory allocation as this is linked to core count.
Sizing the flow thread pool
The thread pool, which the node utilises for running flows in parallel, is key to unlocking this scaling. This thread pool has a finite size. The default settings
are for the number of threads to be 2x the number of cores, but capped at 30. The Corda Enterprise requirements are for a database connection per flow, so this cap helps to reduce unexpected
incidents of running out of database connections. If your database server is configured to allow many more connections, and you have plenty of cores, then the flow thread
pool should be configured to be much larger. A good starting point is to go with 4x core count. For example, on a 32-core host, set the flowThreadPoolSize to 128.
See corda-configuration-file for more information on how to configure this setting.
The performance tests shown in the chart above were carried out following this ratio of 4x cores for flowThreadPoolSize. Increasing the number of threads for flows and the number of RPC clients currently just leads to an offsetting increase in database query times (and a decrease in database throughput).
Sizing the heap
The Corda Enterprise performance tests are usually run with 32GB heaps as this seems to give plenty of breathing room to the node JVM process. Settings below
1GB certainly start to apply memory pressure, can result in an OutOfMemoryError, and are therefore not recommended. This is due to many internal data structures within the
Artemis MQ message broker and several caches in the Corda Enterprise node that have fixed upper bounds. Typically you want to be generous with the heap size.
As with other JVM processes, do not set the maximum heap size of the node to use all available memory on the host. The operating system, file buffers, threads etc all consume non-heap memory.
It is also worth knowing that by default Netty, part of the embedded Artemis MQ broker (when it is indeed embedded in the node JVM process), will allocate chunks of memory for internal buffers from a pool size based on CPU core count. So if you wish to run on hosts with very large core counts, be sure to allocate a larger heap. Assume 16MB per core.
There are several fixed sized caches in Corda that means there is a minimum memory footprint. Other caches do resize as heap size varies, including the transaction cache which is referred to during vault queries and transaction verification and resolution to reduce database accesses. It will take a minimum of 8MB of heap and up to 5% of the maximum heap size. So for a 1GB heap, this would be approximately 50MB. You will find that the amount of various data elements in the node that can be cached will grow linearly with the configured maximum heap size because of these resizing caches and so a large heap may result in greater node throughput if certain round trips to the database are hampering performance.
It’s also important to take into account the memory footprint of live (i.e. incomplete) flows. The more live flows a node has, the more memory they will consume.
Limiting outstanding flows
It is currently possible to start flows in the node at a faster rate than they complete. This will lead to increased memory footprint and heap usage
in the local node and potentially remote nodes. Techniques for helping in this scenario will be the subject of future releases. In the meantime, it
may be necessary to limit the number of outstanding flows in the RPC client, by only allowing a certain number of incomplete Future-s as returned
from startFlow. Corda Enterprise Edition 4.0 provides better scheduling than earlier releases, so the latency impacts of outstanding flows have mostly been eliminated.
Network bandwidth
In the highest throughput scenarios in Figure 1, node A experiences between 500 and 600Mbit/s outbound network traffic. The inbound network traffic is much less,
because the flow checkpoint traffic is write-only under normal circumstances. In order to maximise the bandwidth available between two nodes,
you must use the useOpenSsl option, as described in Configuring a node. The JVM implementation of SSL is restricted in the
bandwidth it can sustain over a single connection.
Comparing Corda Enterprise Edition 4.3 vs Corda Enterprise Edition 4.6
This section contains a comparative analysis between Corda Enterprise Edition 4.3 and Corda Enterprise Edition 4.6, with a main focus on the parallelisation improvements introduced in version 4.5. The analysis also covers some of the improvements introduced in version 4.4. The features discussed are listed below:
- The batched transaction resolution, introduced in version 4.4.
- The new Artemis tuning options (
brokerConnectionTtlCheckIntervalMsandjournalBufferTimeout), introduced in version 4.4. - The new
sendAllAPI for sending messages to multiple parties in a more efficient way. - The p2p message compression, introduced in version 4.5.
- The parallelised flows (
CollectSignaturesFlow,FinalityFlow), introduced in version 4.5.
Test setup
The settlement CorDapp was used for the purpose of these tests, as described in the introductory page of our performance test suite documentation. A test network was created that contained 11 nodes in total - one node acting as the central exchange node, and the remaining 10 nodes acting as nodes that were owning and exchanging assets. These 10 nodes were split into two groups of equal size. The first group was initially issued some cash, and the second group was issued some stocks. Each node from the first group formed a pair with a node from the second group, which indicated the nodes between which assets would be exchanged. The load consisted of Corda transactions that exchanged two states (one cash for one stock) between every pair of nodes. In some cases, backchains were also generated by means of exchanging the initially issued assets bilaterally between the pair, so that the other pairs were forced to perform transaction resolution during the transaction that performed the asset swaps.
Environment setup
During the tests, multiple Corda nodes were deployed on a single machine. Replicating the same tests with one dedicated machine for every Corda node is expected to achieve better results in absolute terms, but the relative differences between versions discussed in this section would still be relevant. The tests were carried out using four dedicated machines that hosted Corda nodes, and four dedicated machines for hosting databases for them. Two of those machines were used to host the notary and its database. The remaining six machines were used to host the remaining Corda nodes and their databases. PostgreSQL was used as a database, and in order to host the databases of multiple Corda nodes on a single machine, a single PostgreSQL instance was run with multiple schemas - one for each Corda node. The nodes were split as evenly as possible - two machines hosted four Corda nodes, and one machine hosted three Corda nodes. Accordingly, two machines hosted four database schemas, and one machine hosted three database schemas.
All these machines were 24 core (48 hyper-threads), based on 2x Intel Xeon E5-2687Wv4 with 256GB RAM and local SSDs, interconnected with a 10GBps network (similar to the tests above).
Results
Latency measurements
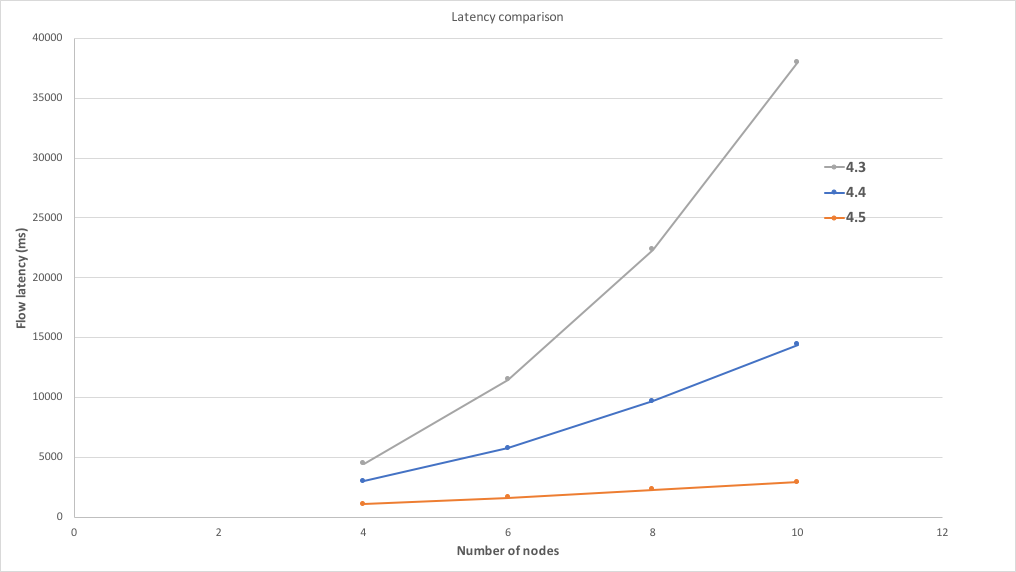
The first test performed was focused on the latency aspect. Load was generated from a single client initialised in a machine that was separate from the ones hosting the Corda nodes and their databases. The load consisted of a pre-defined number of flows (400) that were executed one after the other sequentially. Each one of those flows was initiated on the central exchange node, which was responsible for collecting signatures from all the parties involved and for finalising the transaction. Each of those flows performed a swap of two states between every pair of nodes, thus leading to a Corda transaction with 10 input and 10 output states. During the test setup, the necessary amount of states was initially issued and each one of those states would be swapped once during the test. In order to also measure the impact of transaction resolution, during the test setup each of these states was transferred bilaterally between the nodes in each pair ten times, thus generating a backchain of depth 10. This meant that during every Corda transaction, each node would have to resolve the backchain of the states belonging to the other pairs - so each node would have to resolve 80 states (8 nodes x 10 states each). In order to also measure the scaling with regard to the number of nodes, the exact same test was repeated with a varying number of participants, starting from 4 nodes and going up to 10. The test was also repeated three times with Corda Enterprise versions 4.3, 4.4, and 4.5. The goal was to isolate the benefits from bulk transaction resolution, introduced in version 4.4, and parallelised flows (CollectSignaturesFlow / FinalityFlow), introduced in version 4.5. The diagram below shows the results of this test, where the x axis indicates the number of nodes participating in the test, and the y axis indicates the average latency of the flow that performed the asset swap in milliseconds.
The main observations from the tests follow below:
- Corda Enterprise Edition 4.3 shows an exponential increase in the latency of the flow as the number of nodes that participate in the transaction is increased. This can be attributed to the following two reasons. Firstly, during the tests the exchange node was performing the
CollectSignaturesFlowandFinalityFlowflows sequentially across the involved nodes, so the more nodes these flows had to iterate over, the more time it took. Secondly, these flows have the capability to trigger the execution of transaction resolution if they identify states for which the node is missing the provenance chain. In Corda Enterprise Edition 4.3, transaction resolution is not performed in bulk - it is performed one state at a time. As a result, every additional node causes a significant amount of extra work to be done. - Corda Enterprise Edition 4.4 demonstrates a large reduction in flow latency, which is mostly thanks to the introduction of bulk transaction resolution. The execution of the flows is still sequential across the nodes, but the cost per node is significantly smaller. As a result, in this version the flow latency scales quasi-linearly with the number of participating nodes.
- Corda Enterprise Edition 4.5 also demonstrates a considerable reduction in flow latency, which is mostly thanks to the parallelised flows. It is also clear that it scales almost optimally as the increase in latency from additional participants is minimal.
Throughput measurements
The second test was focused on the throughput aspect. Load was generated from multiple clients initialised on the machines that were hosting the Corda nodes, which were acting as JMeter servers orchestrated by a JMeter client running on a separate machine. The goal was to saturate the participating Corda nodes and to prevent the single client from becoming the bottleneck. During the test setup, each client issued one state to every node. Each client was then performing one flow at a time, swapping these states between the participating nodes. No backchain was generated as part of this test. As a result, the test was executed only between Corda Enterprise Edition 4.3 and Corda Enterprise Edition 4.5, and with a varying number of nodes ranging from 2 up to 10. Each of the machines driving the load was using 120 concurrent clients, which summed up to 480 concurrent clients in total. Additional measurements were performed with a varying number of clients, in order to ensure that this was the optimal number of clients to saturate the nodes without overloading them. Since the throughput was different depending on the number of participating nodes, the total number of requests was also adjusted accordingly in order to get roughly the same total duration of approximately 20 minutes. In all the scenarios, it was confirmed that the nodes had reached a stable state when the test ended. The diagram below shows the results of this test, where the x axis indicates the number of nodes participating in the test, and the y axis indicates the average throughput measured in the number of flows completed per second.
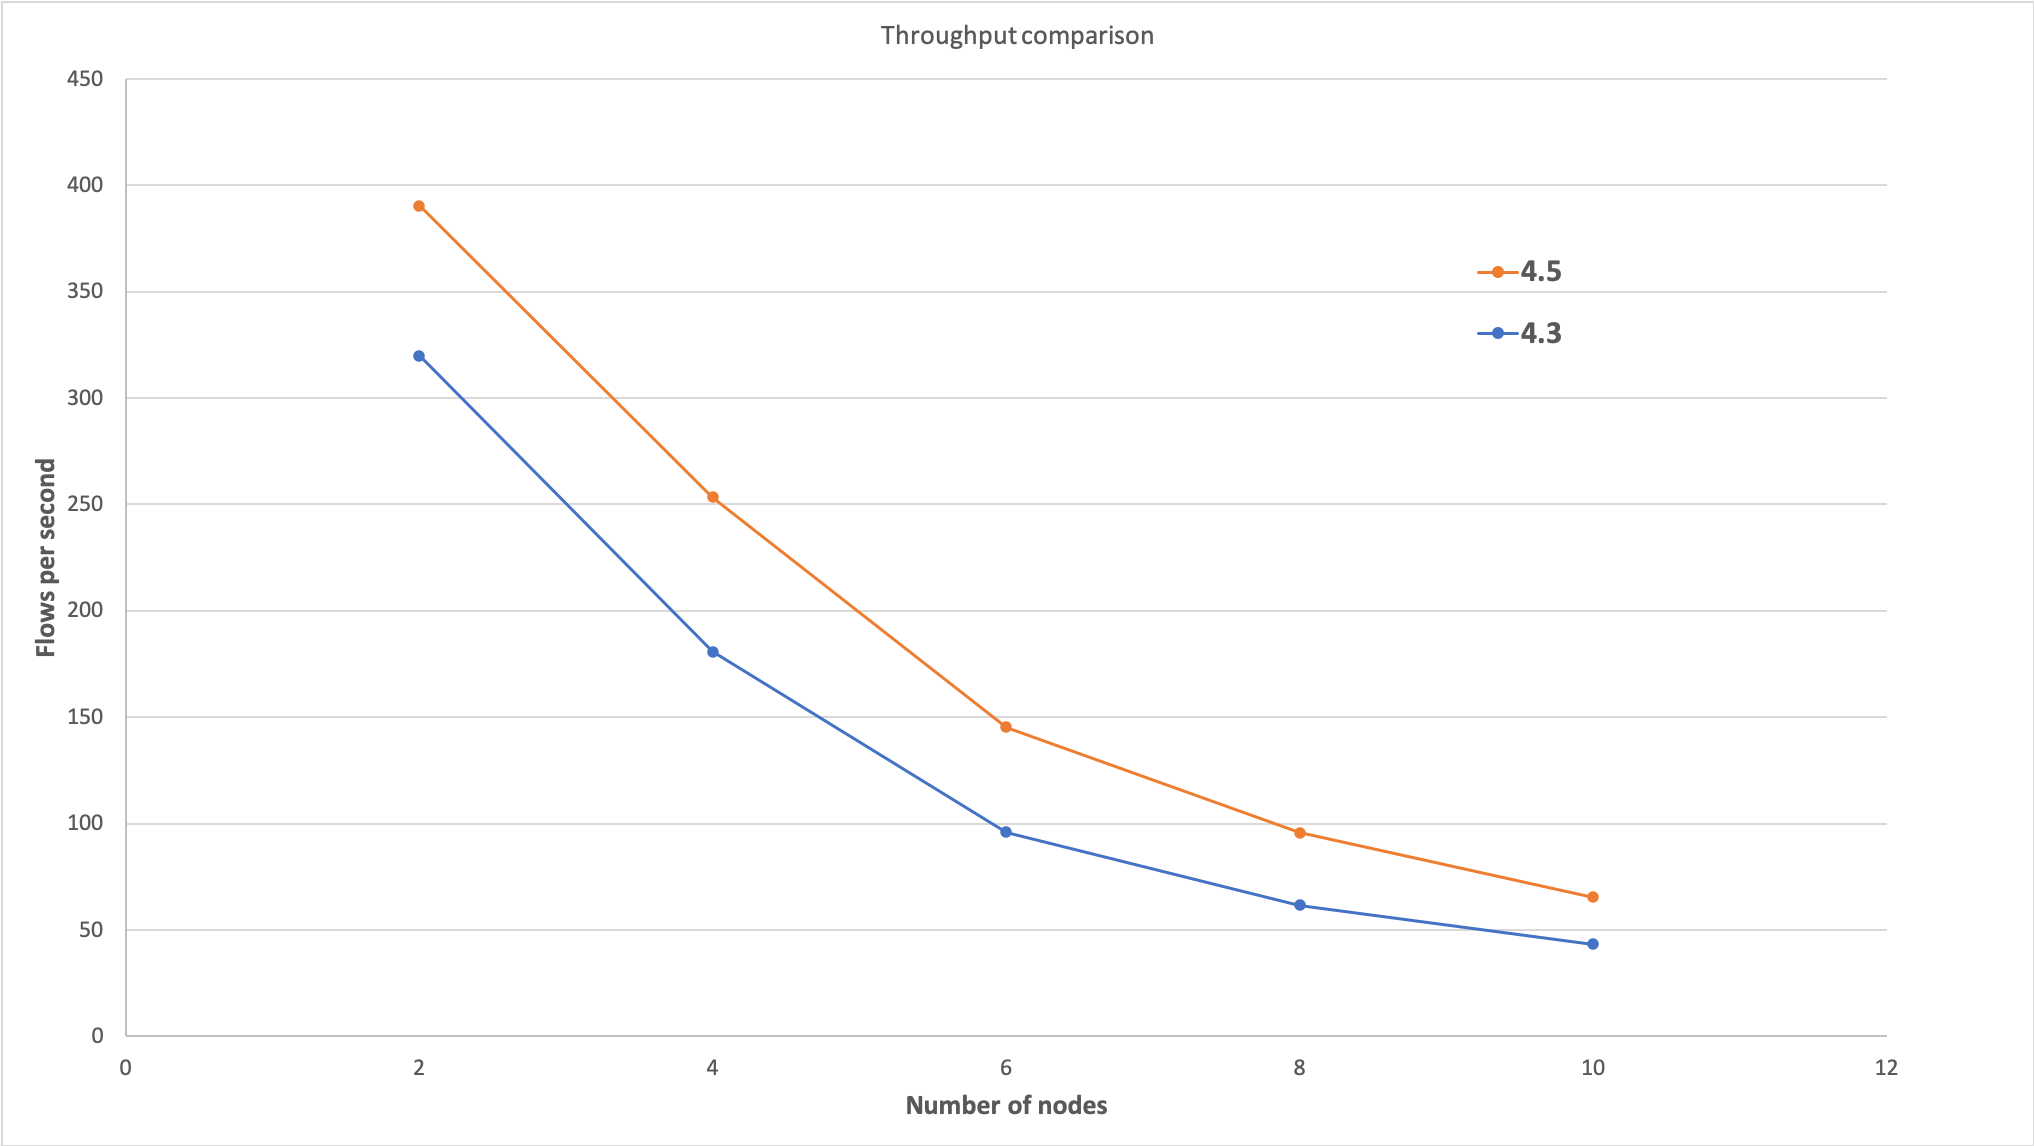
The main observations from the tests follow below:
- Corda Enterprise Edition 4.5 can achieve a significantly higher throughput when compared to Corda Enterprise Edition 4.3. This can be attributed to the following factors:
- In Corda Enterprise Edition 4.5, flows that execute in parallel have a significantly lower latency, as shown above. Such reduced latency means that nodes are able to complete more flows in the same amount of time, thus achieving a higher throughput.
- In Corda Enterprise Edition 4.5, P2P messages between nodes can be compressed, which can lead to a more efficient use of network bandwidth.
- In Corda Enterprise Edition 4.5, parallelised flows take advantage of the new
sendAllAPI in order to send messages in parallel to multiple parties. This means that a smaller number of checkpoints are created overall, thus leading to a more efficient use of the database.
- It has become clear from the tests that the throughput decreases as more nodes are added. The difference in throughput between Corda Enterprise Edition 4.3 and Corda Enterprise Edition 4.5 gets smaller as more nodes participate in the transaction. This is most likely due to environmental issues: as mentioned above, the tests described here involved the deployment of multiple Corda nodes per physical machine, leading to the nodes sharing physical resources and thus interfering with one another. If the same test is repeated using a dedicated machine per Corda node, it is very likely that a much higher throughput would be observed for both Corda Enterprise versions, with a larger difference between the two versions when more nodes are involved.
Impact of new tuning options
The last test performed was focused on the impact of some of the new tuning options introduced in Corda Enterprise Edition 4.5. The goal of this test was to provide some insight into the behaviour of these parameters, and to evaluate the default options. The options that were covered were those controlling the flush frequency of Artemis buffers (brokerConnectionTtlCheckIntervalMs and journalBufferTimeout), and the option controlling P2P message compression (enableP2PCompression). For more information, see Node configuration.
Five different variations were tested, as follows:
- The default configuration, which had
brokerConnectionTtlCheckIntervalMs = 20,journalBufferTimeout = 3333333andenableP2PCompression = trueconfigured. This variation is called “default” in the graphs below. - A configuration that flushes very frequently. It had
brokerConnectionTtlCheckIntervalMs = 1andjournalBufferTimeout = 1000000configured. This variation is called “artemis-frequent-flush” in the graphs below. - A configuration that flushes in a medium frequency. It had
brokerConnectionTtlCheckIntervalMs = 10andjournalBufferTimeout = 10000000configured. This variation is called “artemis-medium-flush” in the graphs below. - A configuration that flushes in a low frequency. It had
brokerConnectionTtlCheckIntervalMs = 20andjournalBufferTimeout = 20000000configured. This variation is called “artemis-infrequent-flush” in the graphs below. - A configuration that disables P2P message compression. It had
enableP2PCompression = falseconfigured. This variation is called “no-compression” in the graphs below.
The purpose of this last test was to investigate the effects of these options in both throughput and latency because some of these options introduce trade-offs between these two aspects. To this end, the tests described earlier in this analysis were repeated using the variations listed above. For the latency measurements, 10 nodes were used because, thanks to the low load, there was no expectation for any big interference between nodes on the same machine. For the throughput measurements, only 4 nodes were used in order to avoid any interference between nodes on the same machine due to the high load. The results are shown in the diagrams below - the x axis contains the variations used, and the y axis shows the average throughput and latency achieved with each variation along with error bars indicating the standard deviation.
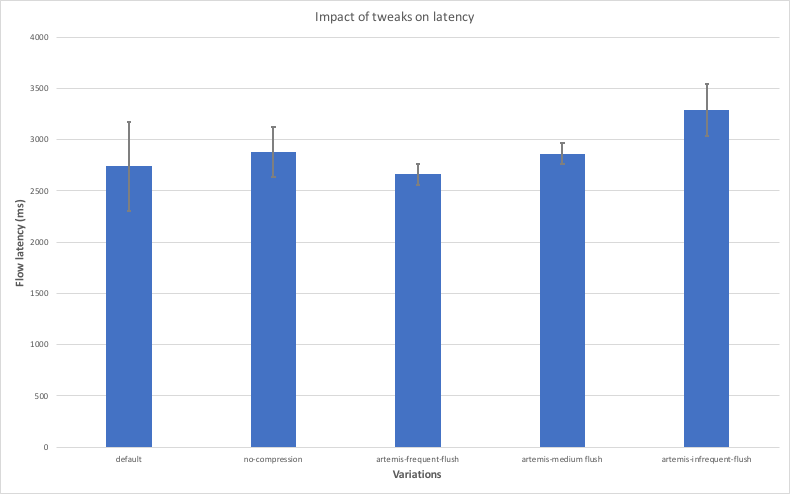
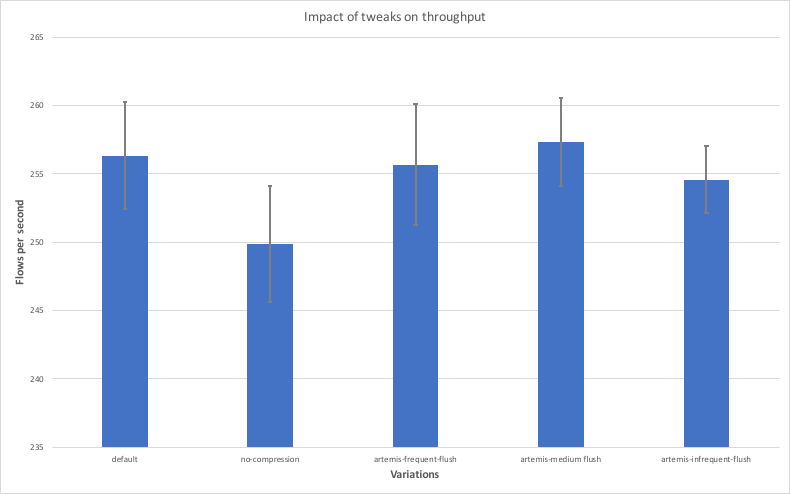
The main observations from the test are as follows:
- Disabling compression leads to lower throughput and higher latency. This is expected because compression introduces a trade-off between CPU and network bandwidth utilisation and in most cases the network would prove to be a bigger bottleneck.
- The “artemis-frequent-flush” variation leads to lower latency but also lower throughput. The reduction in latency is thanks to the fact that buffered messages are sent to counterparties more frequently, thus allowing flows to make progress faster. The decrease in throughput is due to the fact that flushing messages more frequently can lead to a more inefficient use of the disk overall.
- The “artemis-medium-flush” variation achieves higher throughput, but at the cost of higher latency. This is in line with the reasoning described above.
- The “artemis-infrequent-flush” demonstrates both lower throughput and higher latency. This indicates that the node enters a somewhat degraded phase, where messages are flushed so infrequently that flows experience long stalls, while the node is not taking full advantage of the disk’s bandwidth.
- The variation that makes use of the default options seems to strike the right balance between latency and throughput.
Was this page helpful?
Thanks for your feedback!
Chat with us
Chat with us on our #docs channel on slack. You can also join a lot of other slack channels there and have access to 1-on-1 communication with members of the R3 team and the online community.
Propose documentation improvements directly
Help us to improve the docs by contributing directly. It's simple - just fork this repository and raise a PR of your own - R3's Technical Writers will review it and apply the relevant suggestions.
We're sorry this page wasn't helpful. Let us know how we can make it better!
Chat with us
Chat with us on our #docs channel on slack. You can also join a lot of other slack channels there and have access to 1-on-1 communication with members of the R3 team and the online community.
Create an issue
Create a new GitHub issue in this repository - submit technical feedback, draw attention to a potential documentation bug, or share ideas for improvement and general feedback.
Propose documentation improvements directly
Help us to improve the docs by contributing directly. It's simple - just fork this repository and raise a PR of your own - R3's Technical Writers will review it and apply the relevant suggestions.