Node management console
The Node management console allows you to see information about a node and perform some operations on it. It runs as a plug-in for the Gateway Service.
The node management console allows you to see the following information about the node:
- General node information, including:
- Platform version.
- Corda version.
- Revision (git hash).
- Whether node draining is enabled.
- Status (such as
RUNNINGorDISCONNECTED).
- Node configuration file.
- Logging (log4j) configuration file.
- The most recent 500 log events.
- The installed CorDapps.
- The list of available drivers.
You can also interact with the node in the following ways:
- Toggle draining mode.
- Gracefully stop the node.
- Kill the node (without draining first).
It has a front end written in React, and a REST service written in Kotlin, which makes RPC calls to Corda Enterprise.
The plug-in consists of two JAR files:
- The node management plug-in:
node-management-plugin-<release>.jar. - The permissions JAR for the plug-in:
auth-baseline-node-management-<release>.jar.
These files can be downloaded from Artifactory: corda-gatewayplugins.
Installation

- Put
node-management-plugin-<release>.jarinto thepluginsdirectory in the Gateway Service. - Put
auth-baseline-node-management-<release>.jarinto thepluginsdirectory in the Auth Service. - Restart the Gateway Service and the Auth Service.
Configuration
You need to set the following values in the Gateway Service configuration file:
- RPC username.
- RPC password.
- RPC port, which can be specified either as a literal string or by the
NODE_PORTenvironment variable. - The host name or IP address of the node you wish to monitor, which can be specified either as a literal string or by the
NODE_HOSTenvironment variable.
These are set in node.management.plugin.middleware as shown below.
node.management.plugin.middleware {
     rpcUsername ="u"
     rpcPassword ="p"
     rpcHost = ${NODE_HOST}
     rpcPort = ${NODE_PORT}
}
Accessing the node management console
The node management plug-in is accessed through the node management console. To access the flow management console, visit the Gateway service plug-in launcher page, http://<gateway-service-ip>:<port>/launcher.
Permissions
A user can have either read-only permissions, or admin permissions. Permissions are set using the User Admin tool, http://<gateway-service-ip>:<port>/admin.
Viewing general node information
General node information is displayed on the Status tab. To access the Status tab:
Log on to the node management console.
Navigate to Status tab.
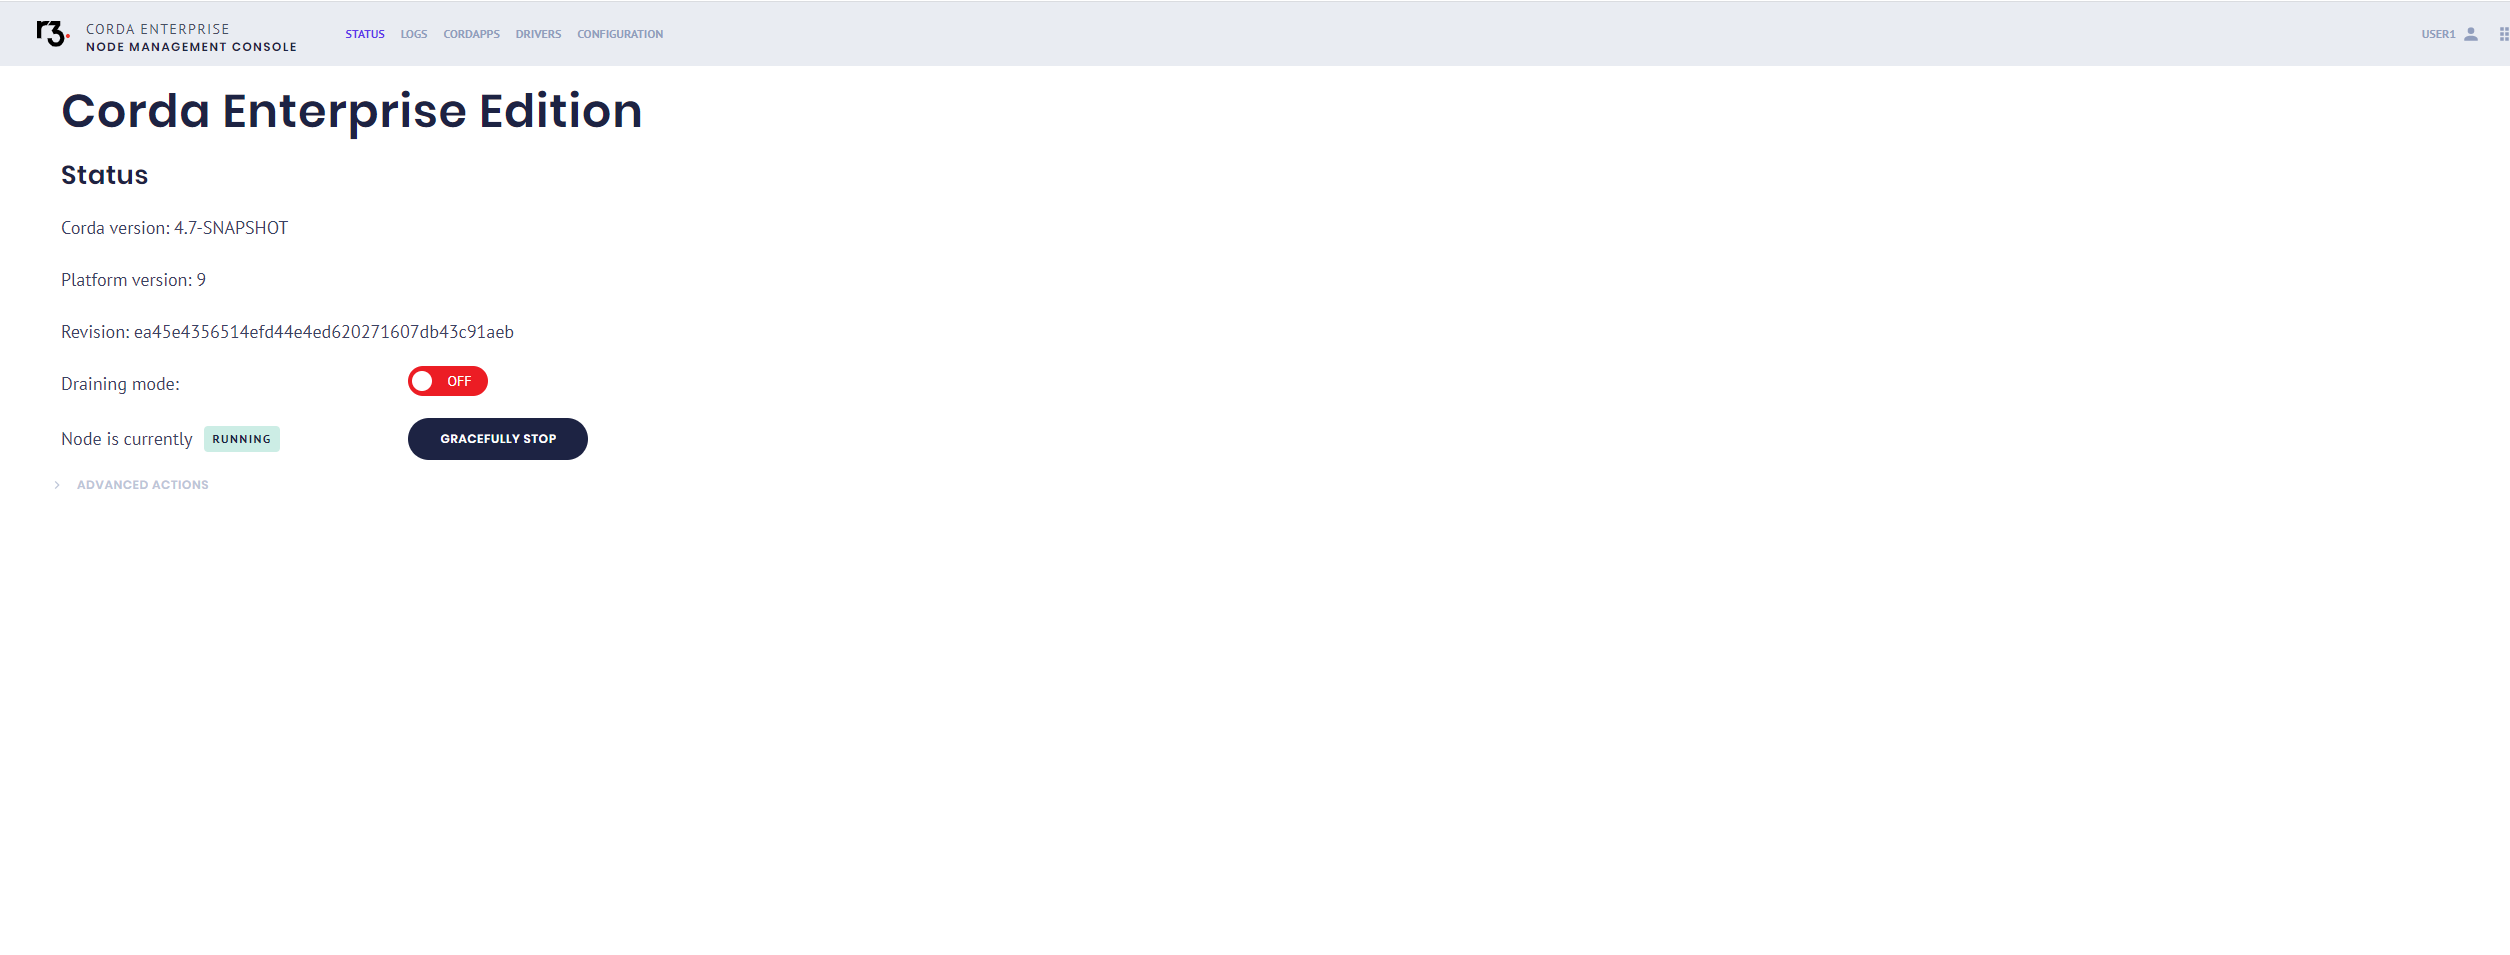
Node management console status tab
Viewing the node configuration file
Log on to the node management console.
Navigate to NODE tab under Configuration.
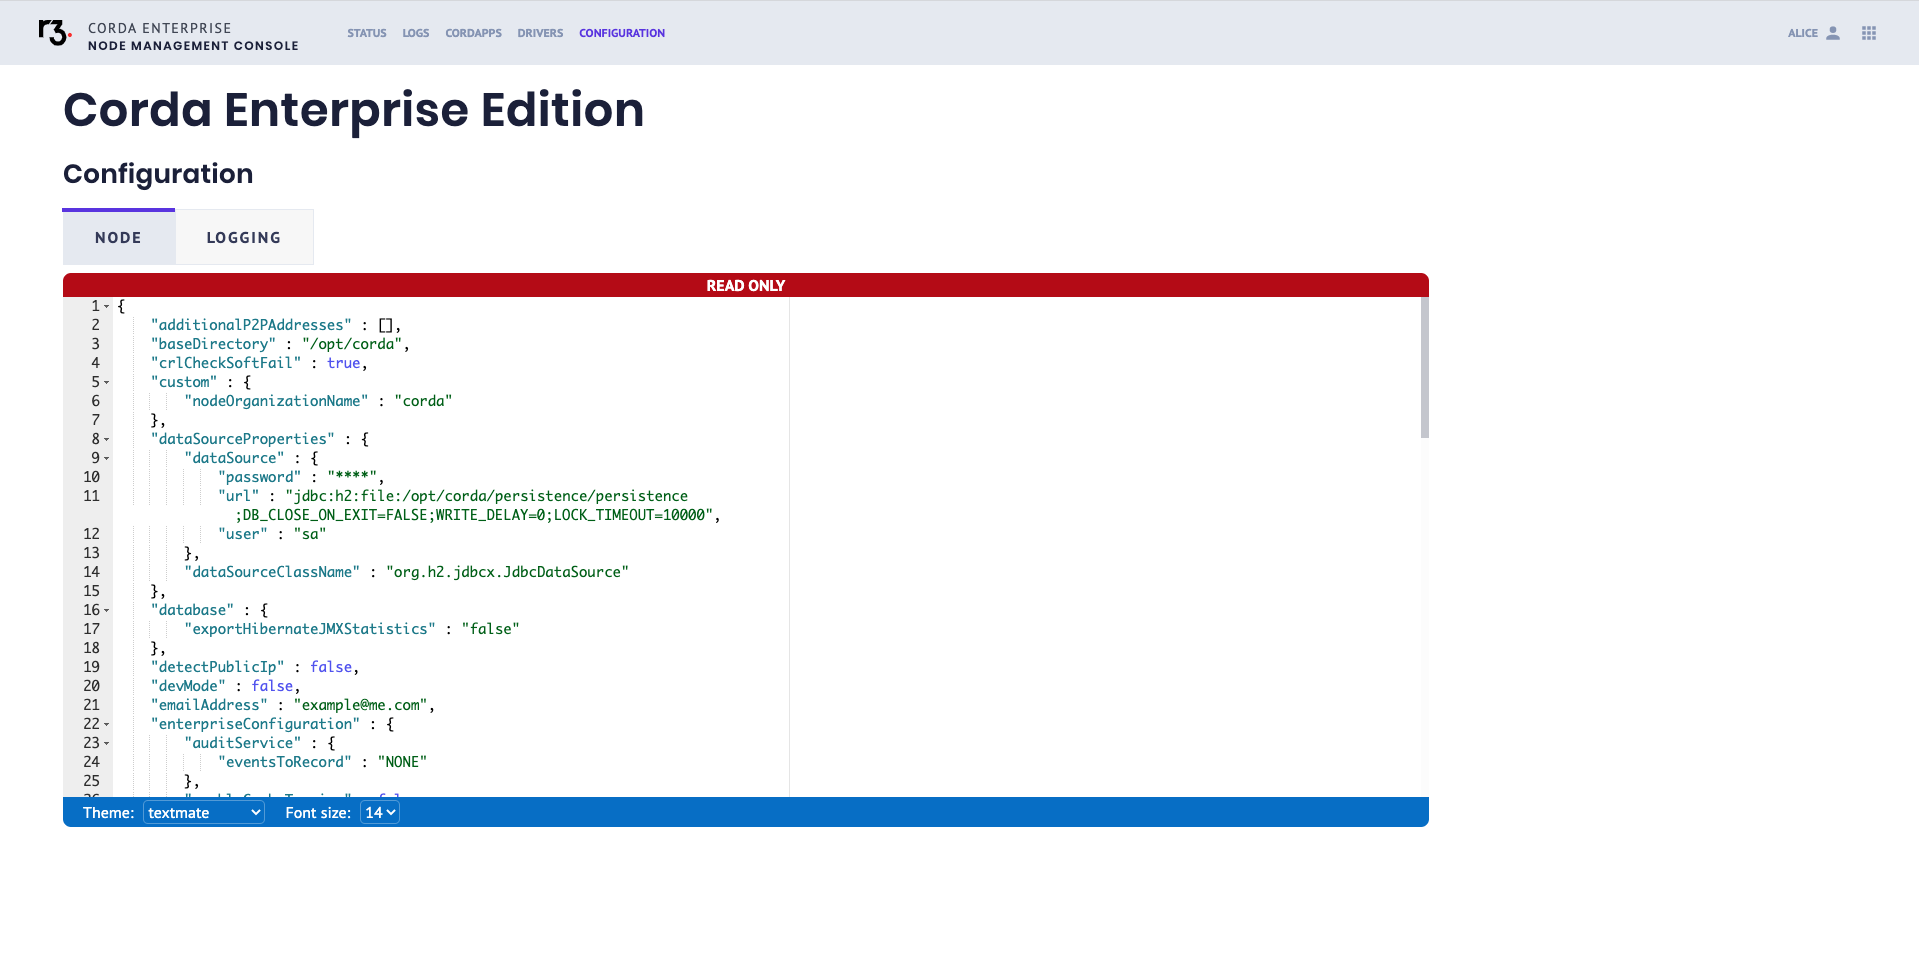
Node management console node configuration tab
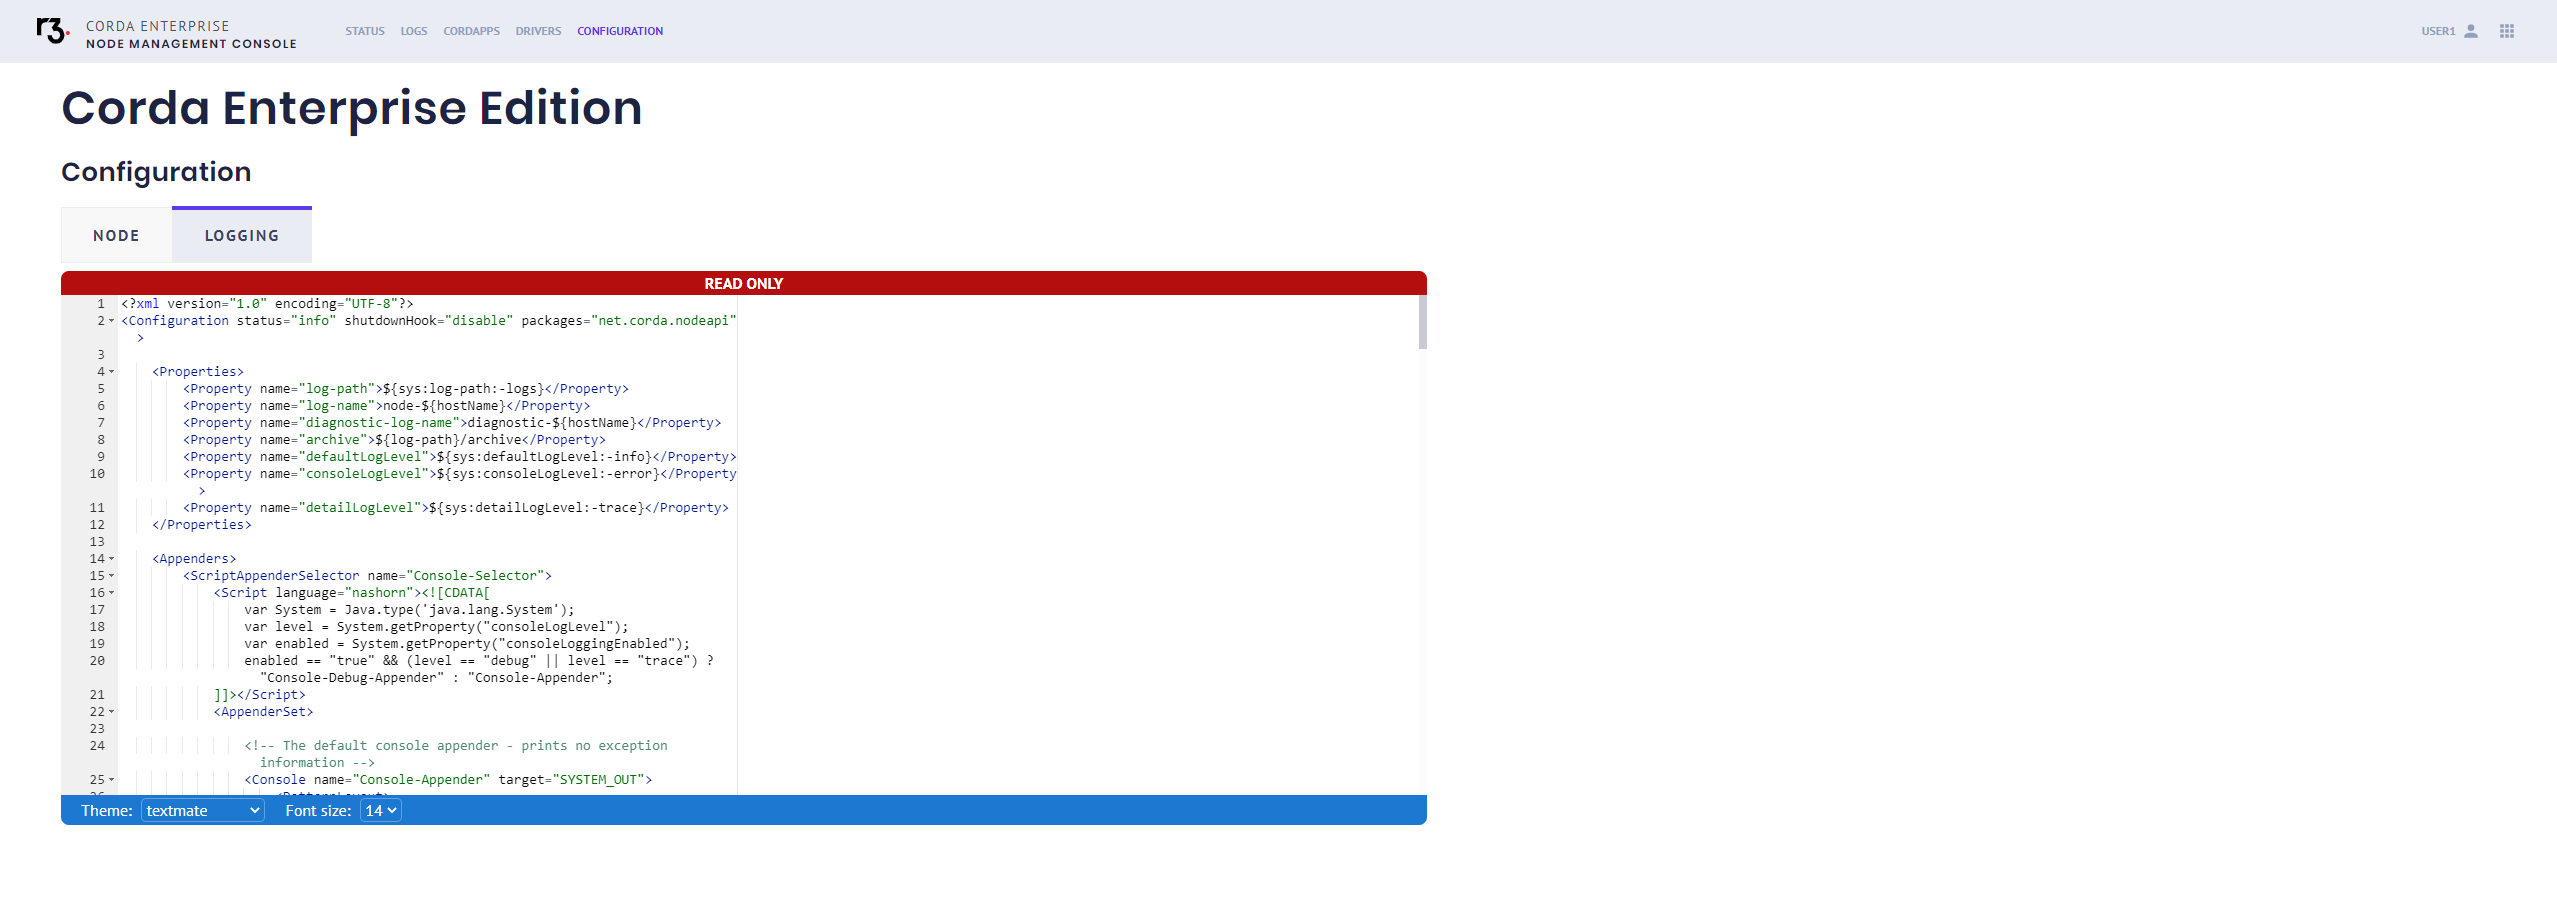
Viewing the log4j configuration file
- Log on to the node management console.
- Navigate to Configuration tab.
- Select the Logging tab above the text editor display.
Logging configuration will be displayed in the text editor. The editor can be configured via footer bar to set language, theme, and font size. The editor will be in read-only mode, so no changes may be made.
Failure conditions
If the file cannot be found, an error panel will be displayed in place of the text editor.
Permission
If you do not have permission to perform this action and you click the tab, a message will be displayed that tells you that you do not have permission to view this page.
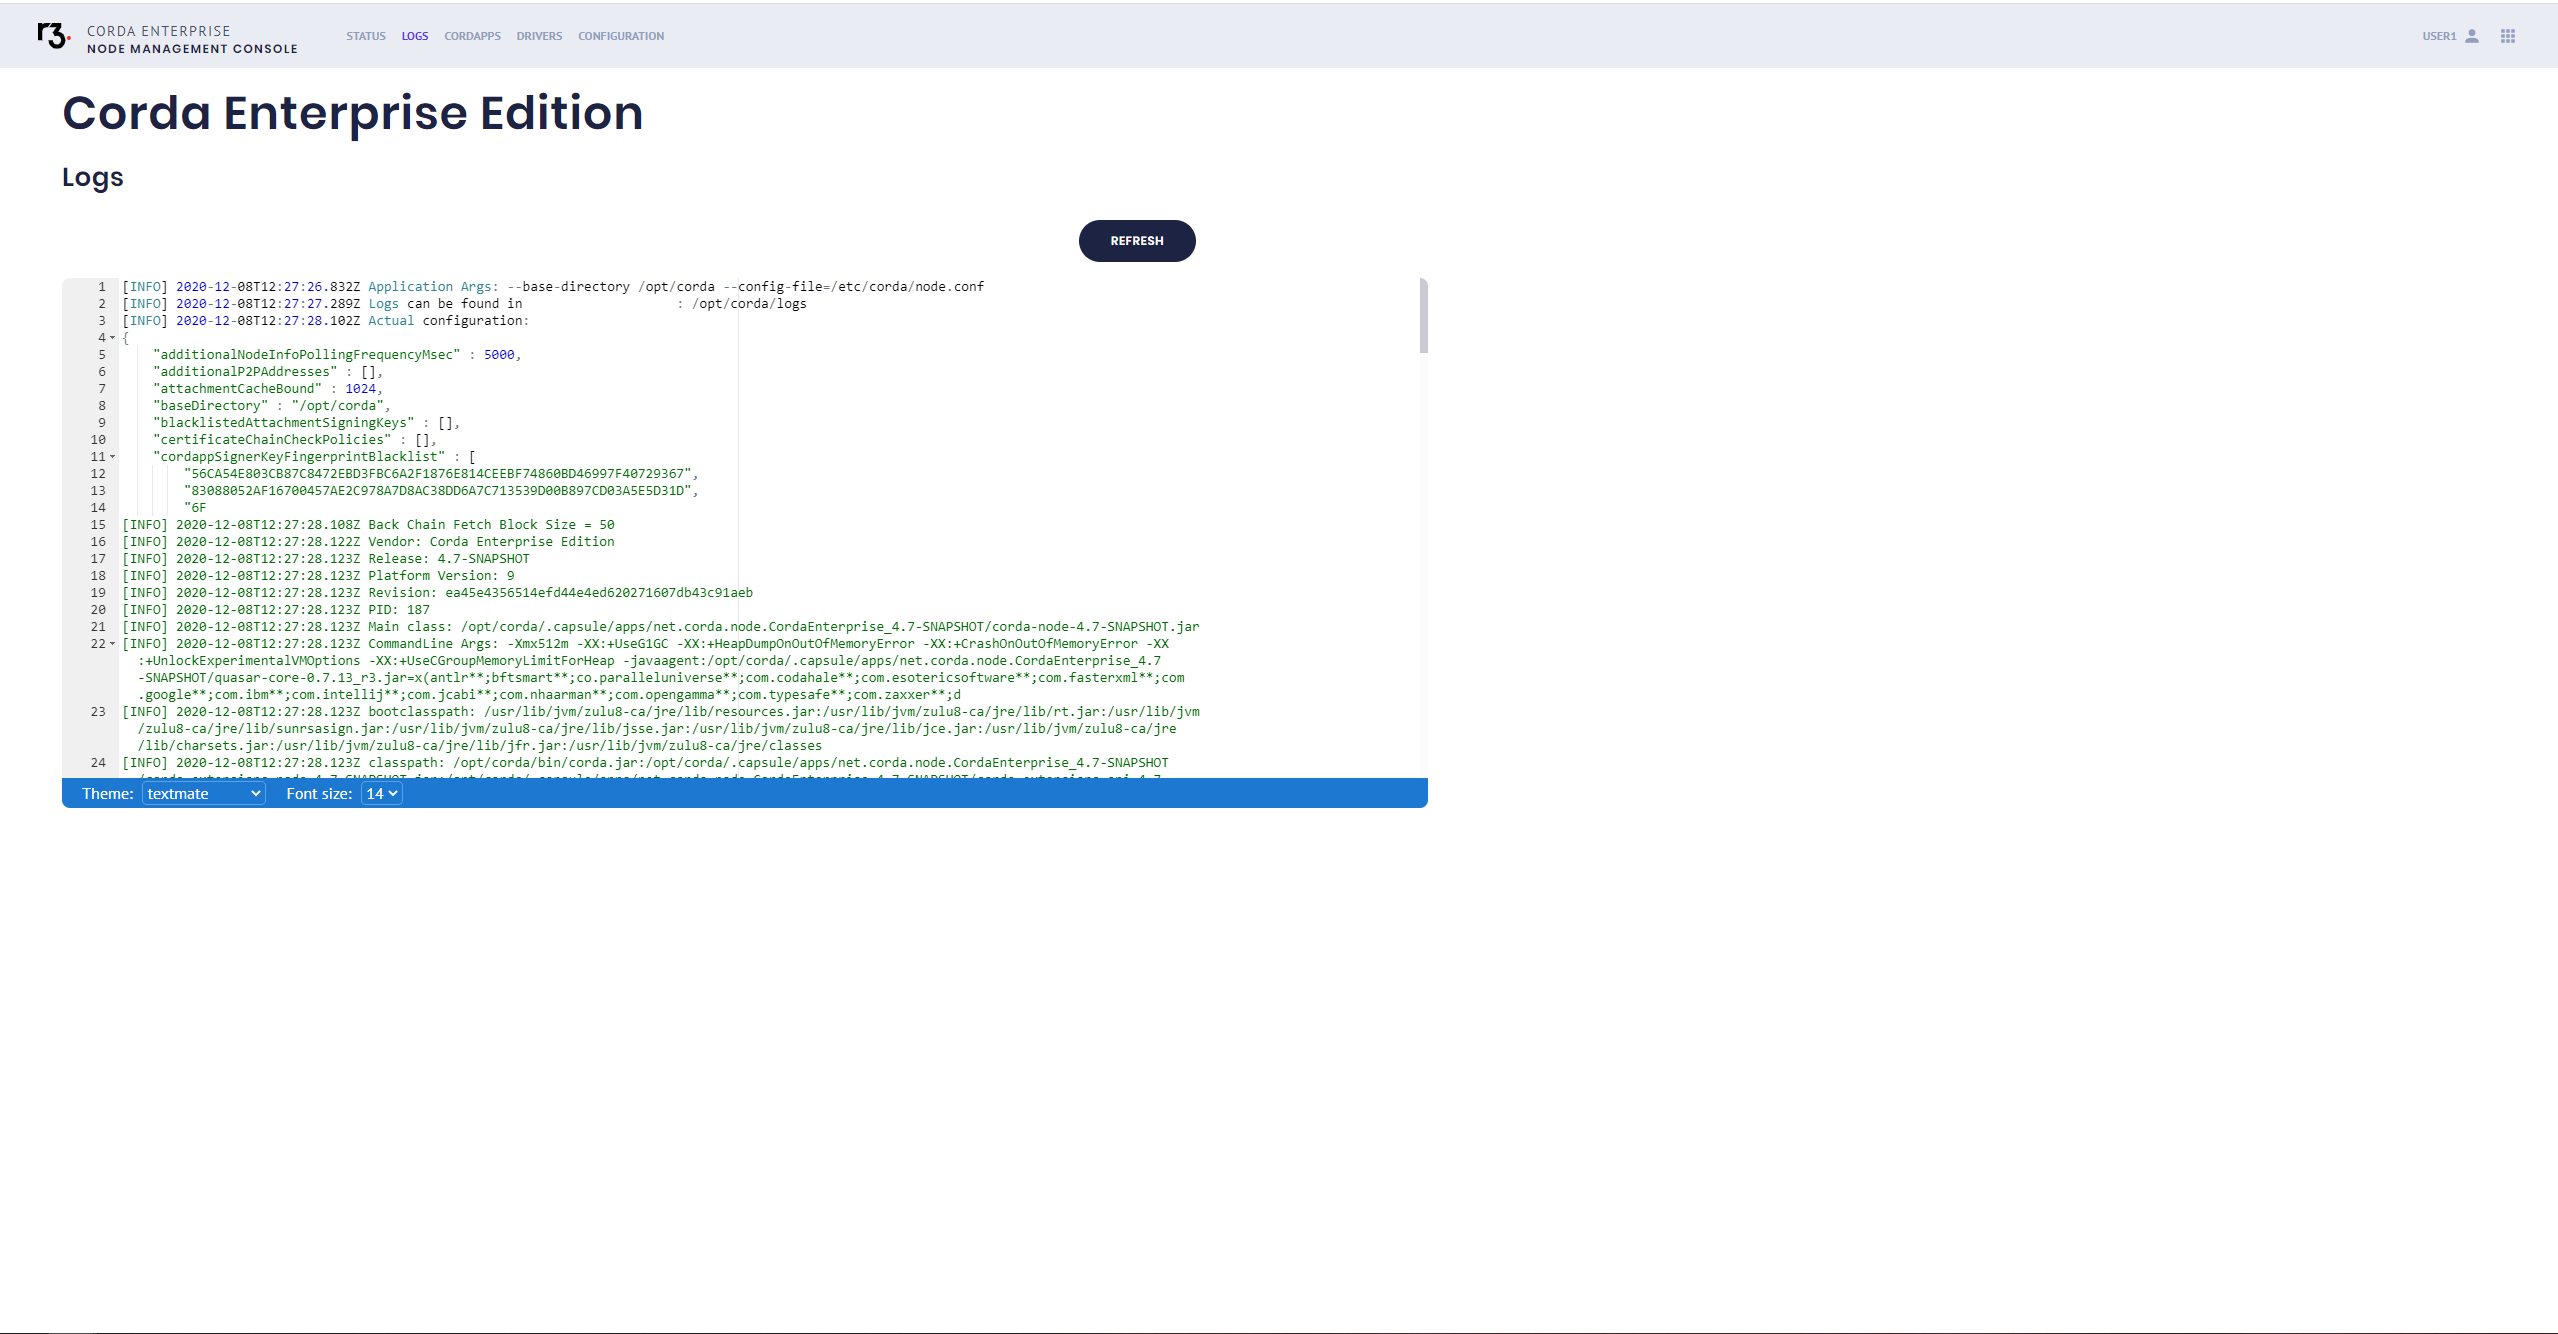
Viewing the node logs
- Log on to the node management console.
- Navigate to Logs tab.
The most recent 500 log events are displayed. Note that this list is static: it does not change. Click Refresh to see the most recent 500 log events. This list does not contain the startup logs.
Failure conditions
If the logs are not in the expected location, a message informs you that the logs could not be found.
Permission
If you do not have permission to perform this action and you click the tab, a message will be displayed that tells you that you do not have permission to view this page.
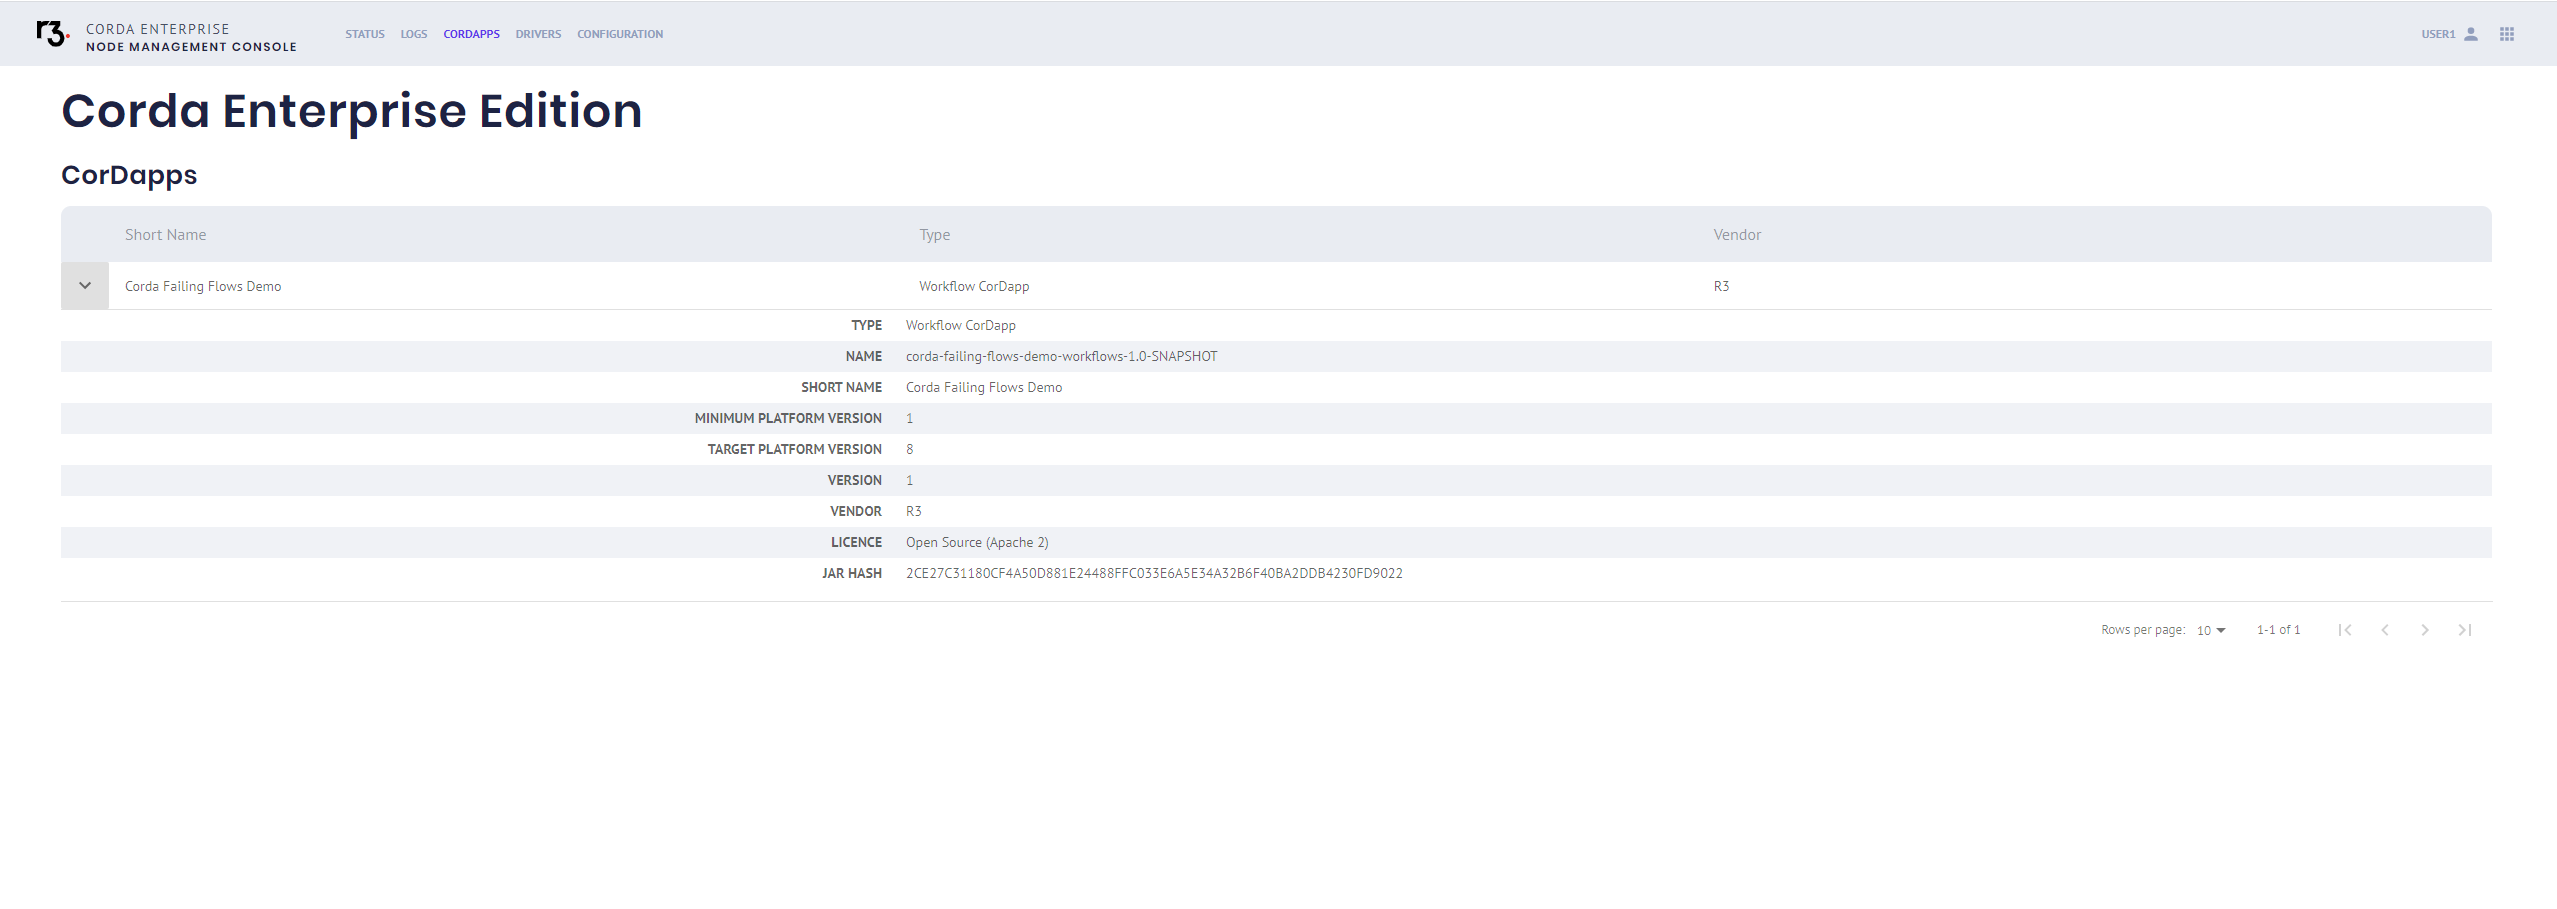
Viewing the installed CorDapps
- Log on to the node management console.
- Navigate to CorDapps tab.
The installed CorDapps will be shown in a table format.
The table will list the short name, type, and vendor for each CorDapp. The table is sortable by these fields.
To view more information about a particular CorDapp, click on an entry in the table and the entry expands to show a more comprehensive list of properties for that CorDapp.
Empty state
If there are no installed CorDapps, a message informs you that no CorDapps are installed on the node.
Permission
If you do not have permission to perform this action and you click the tab, a message will be displayed that tells you that you do not have permission to view this page.
Further information
- The CorDapp fields are retrieved as a
CordappInfoobject from the Corda API.- View the API documentation.
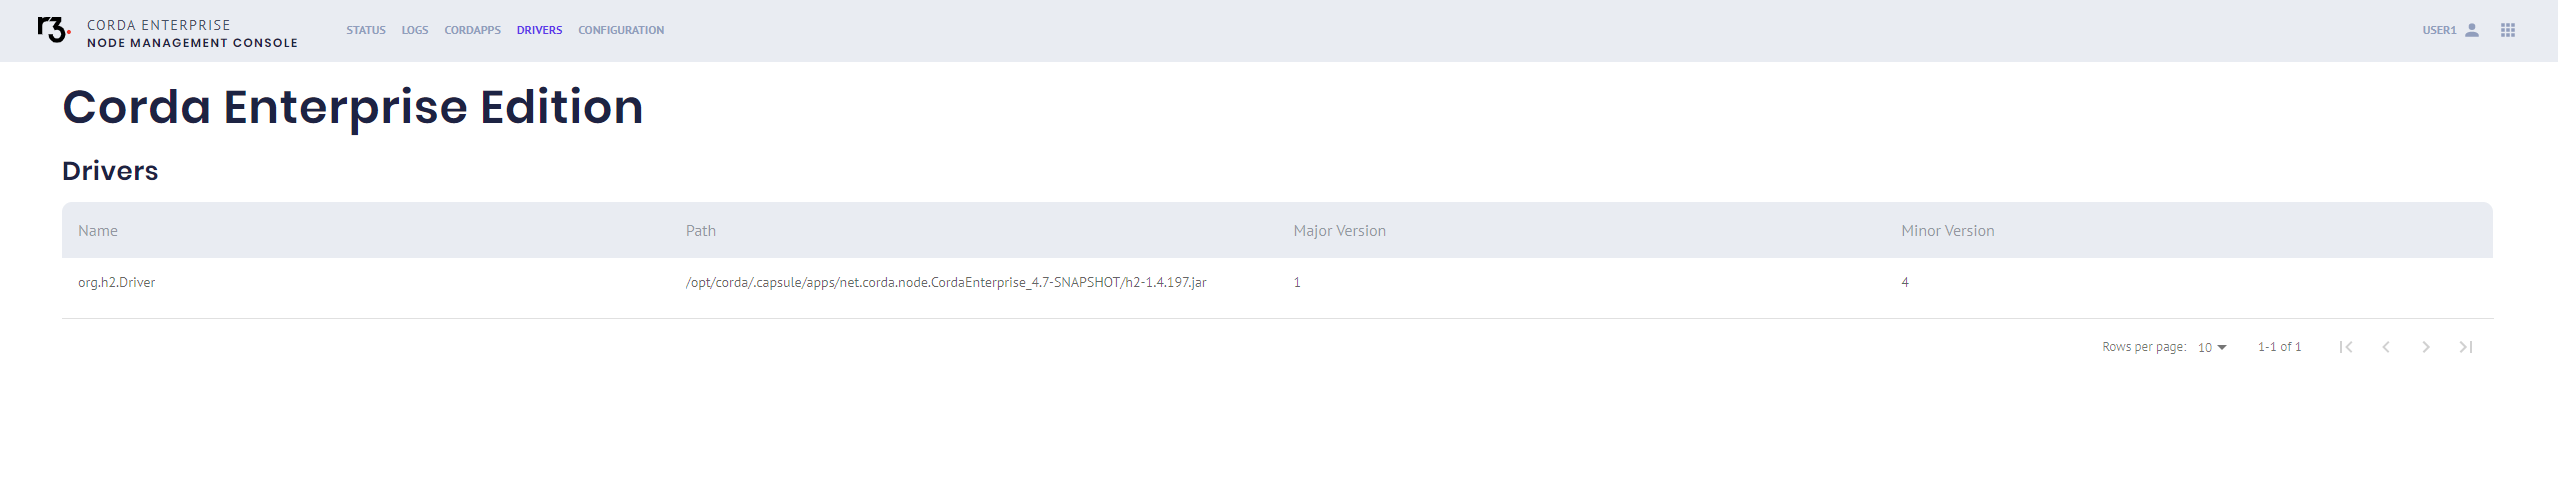
Viewing available drivers
- Log on to the node management console.
- Navigate to Drivers tab.
A table shows the names of the drivers on the node.
Empty state
If there are no available drivers, a message informs you that there are no available drivers.
Permission
If you do not have permission to perform this action and you click the tab, a message will be displayed that tells you that you do not have permission to view this page.
Toggling draining mode
Log on to the node management console.
Navigate to Status tab.
Click the Draining mode toggle to turn draining mode on or off.
Node management console status tab
Shutting down a node gracefully
Shutting down a node gracefully enables draining mode, waits for in-flight flows to complete, and then stops the node.
- Log on to the node management console.
- Navigate to Status tab.
- Click Gracefully stop. A prompt will be shown asking you to confirm.
- Click Yes.
Draining mode is turned on, and the draining mode toggle and the buttons for Gracefully Stop and Kill Node are disabled.
Then a popup message states that graceful stop has begun.
Once the node has been stopped:
- The status label changes from RUNNING to DISCONNECTED.
- A popup message states that graceful stop was successful.
When the node management console is reloaded, the node diagnostic info is unavailable, therefore:
- The buttons and toggle do not display.
- The unavailable node information shows as
---.
Permission
If you do not have permission to perform these actions:
- The buttons will be greyed out.
- A tool tip will state that you do not have permission to perform the action.
Further information
- The Status fields are retrieved as a
NodeDiagnosticInfoobject from the Corda API.- View the API documentation
- The calls to gracefully stop or kill a node, or to toggle drainage mode:
- Make a REST call to the Node Management REST service.
- The REST service connects to the node via a
CordaRPCServiceconnection to execute the command.
Killing a node
Killing a node stops the node without draining it first.
- Log on to the node management console.
- Navigate to Status tab.
- Click Advanced actions.
- Click Kill node. A prompt will be shown asking you to confirm.
- Click Yes.
The draining mode toggle and the buttons for Gracefully Stop and Kill Node are disabled.
Then a popup message states that the killing of the node was successful.
Once the node has been killed:
- The status label changes from RUNNING to DISCONNECTED.
- A popup message states that the killing of the node was successful.
When the node management console is reloaded, the node diagnostic info is unavailable, therefore:
- The buttons and toggle do not display.
- The unavailable node information shows as
---.
Permission
If you do not have permission to perform these actions:
- The buttons will be greyed out.
- A tool tip will state that you do not have permission to perform the action.
Status code 500 errors
A status code 500 error indicates that the node cannot be reached, perhaps because it has been shut down.
Was this page helpful?
Thanks for your feedback!
Chat with us
Chat with us on our #docs channel on slack. You can also join a lot of other slack channels there and have access to 1-on-1 communication with members of the R3 team and the online community.
Propose documentation improvements directly
Help us to improve the docs by contributing directly. It's simple - just fork this repository and raise a PR of your own - R3's Technical Writers will review it and apply the relevant suggestions.
We're sorry this page wasn't helpful. Let us know how we can make it better!
Chat with us
Chat with us on our #docs channel on slack. You can also join a lot of other slack channels there and have access to 1-on-1 communication with members of the R3 team and the online community.
Create an issue
Create a new GitHub issue in this repository - submit technical feedback, draw attention to a potential documentation bug, or share ideas for improvement and general feedback.
Propose documentation improvements directly
Help us to improve the docs by contributing directly. It's simple - just fork this repository and raise a PR of your own - R3's Technical Writers will review it and apply the relevant suggestions.